

Before you start
- Debug mode is for flow agents. For a single prompt agent’s call, use call details: the transcript, the recording, the logs and reply time.
- You need the View permission on the Conversation log. To open the version a call ran on in the editor, you also need View on agents. See Roles and permissions.
Open debug mode
1
Open the call
In the Conversation log, click a flow agent’s call. Its details open beside the list.
2
Click Debug mode
Click Debug mode at the end of the tab row. Or press Cmd+K (Ctrl+K on Windows) and choose Open debug mode.
A tour of the screen
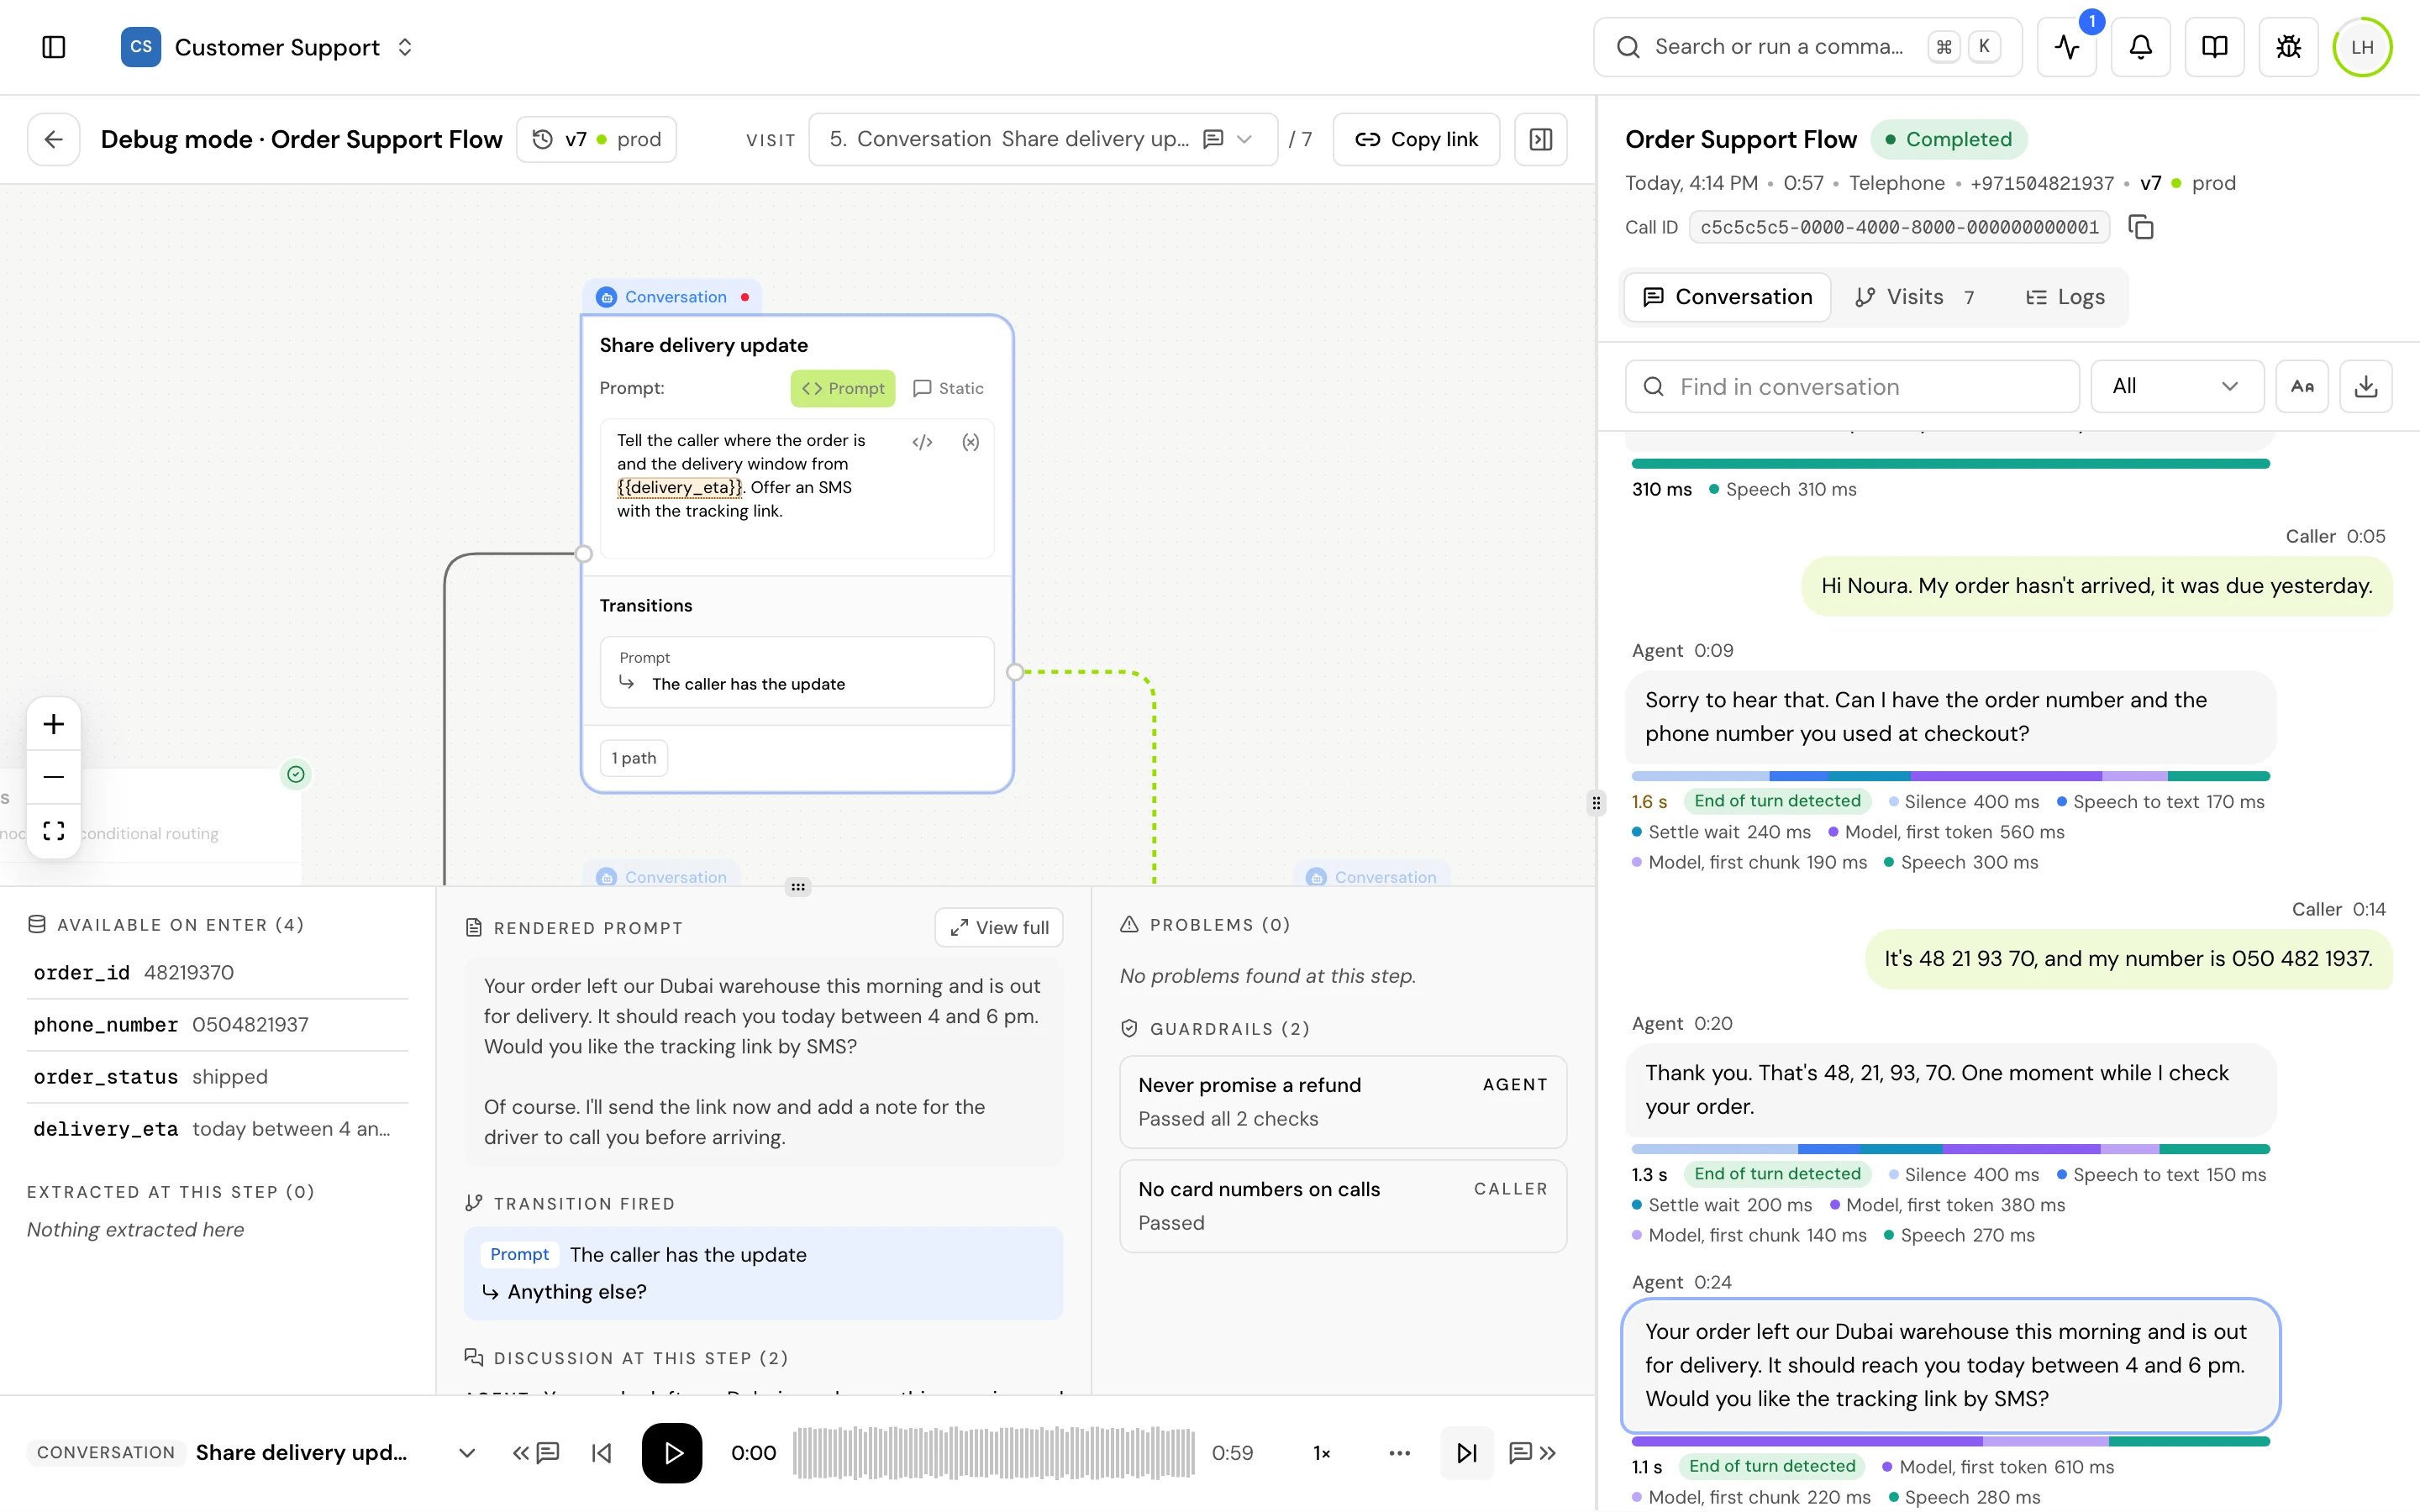
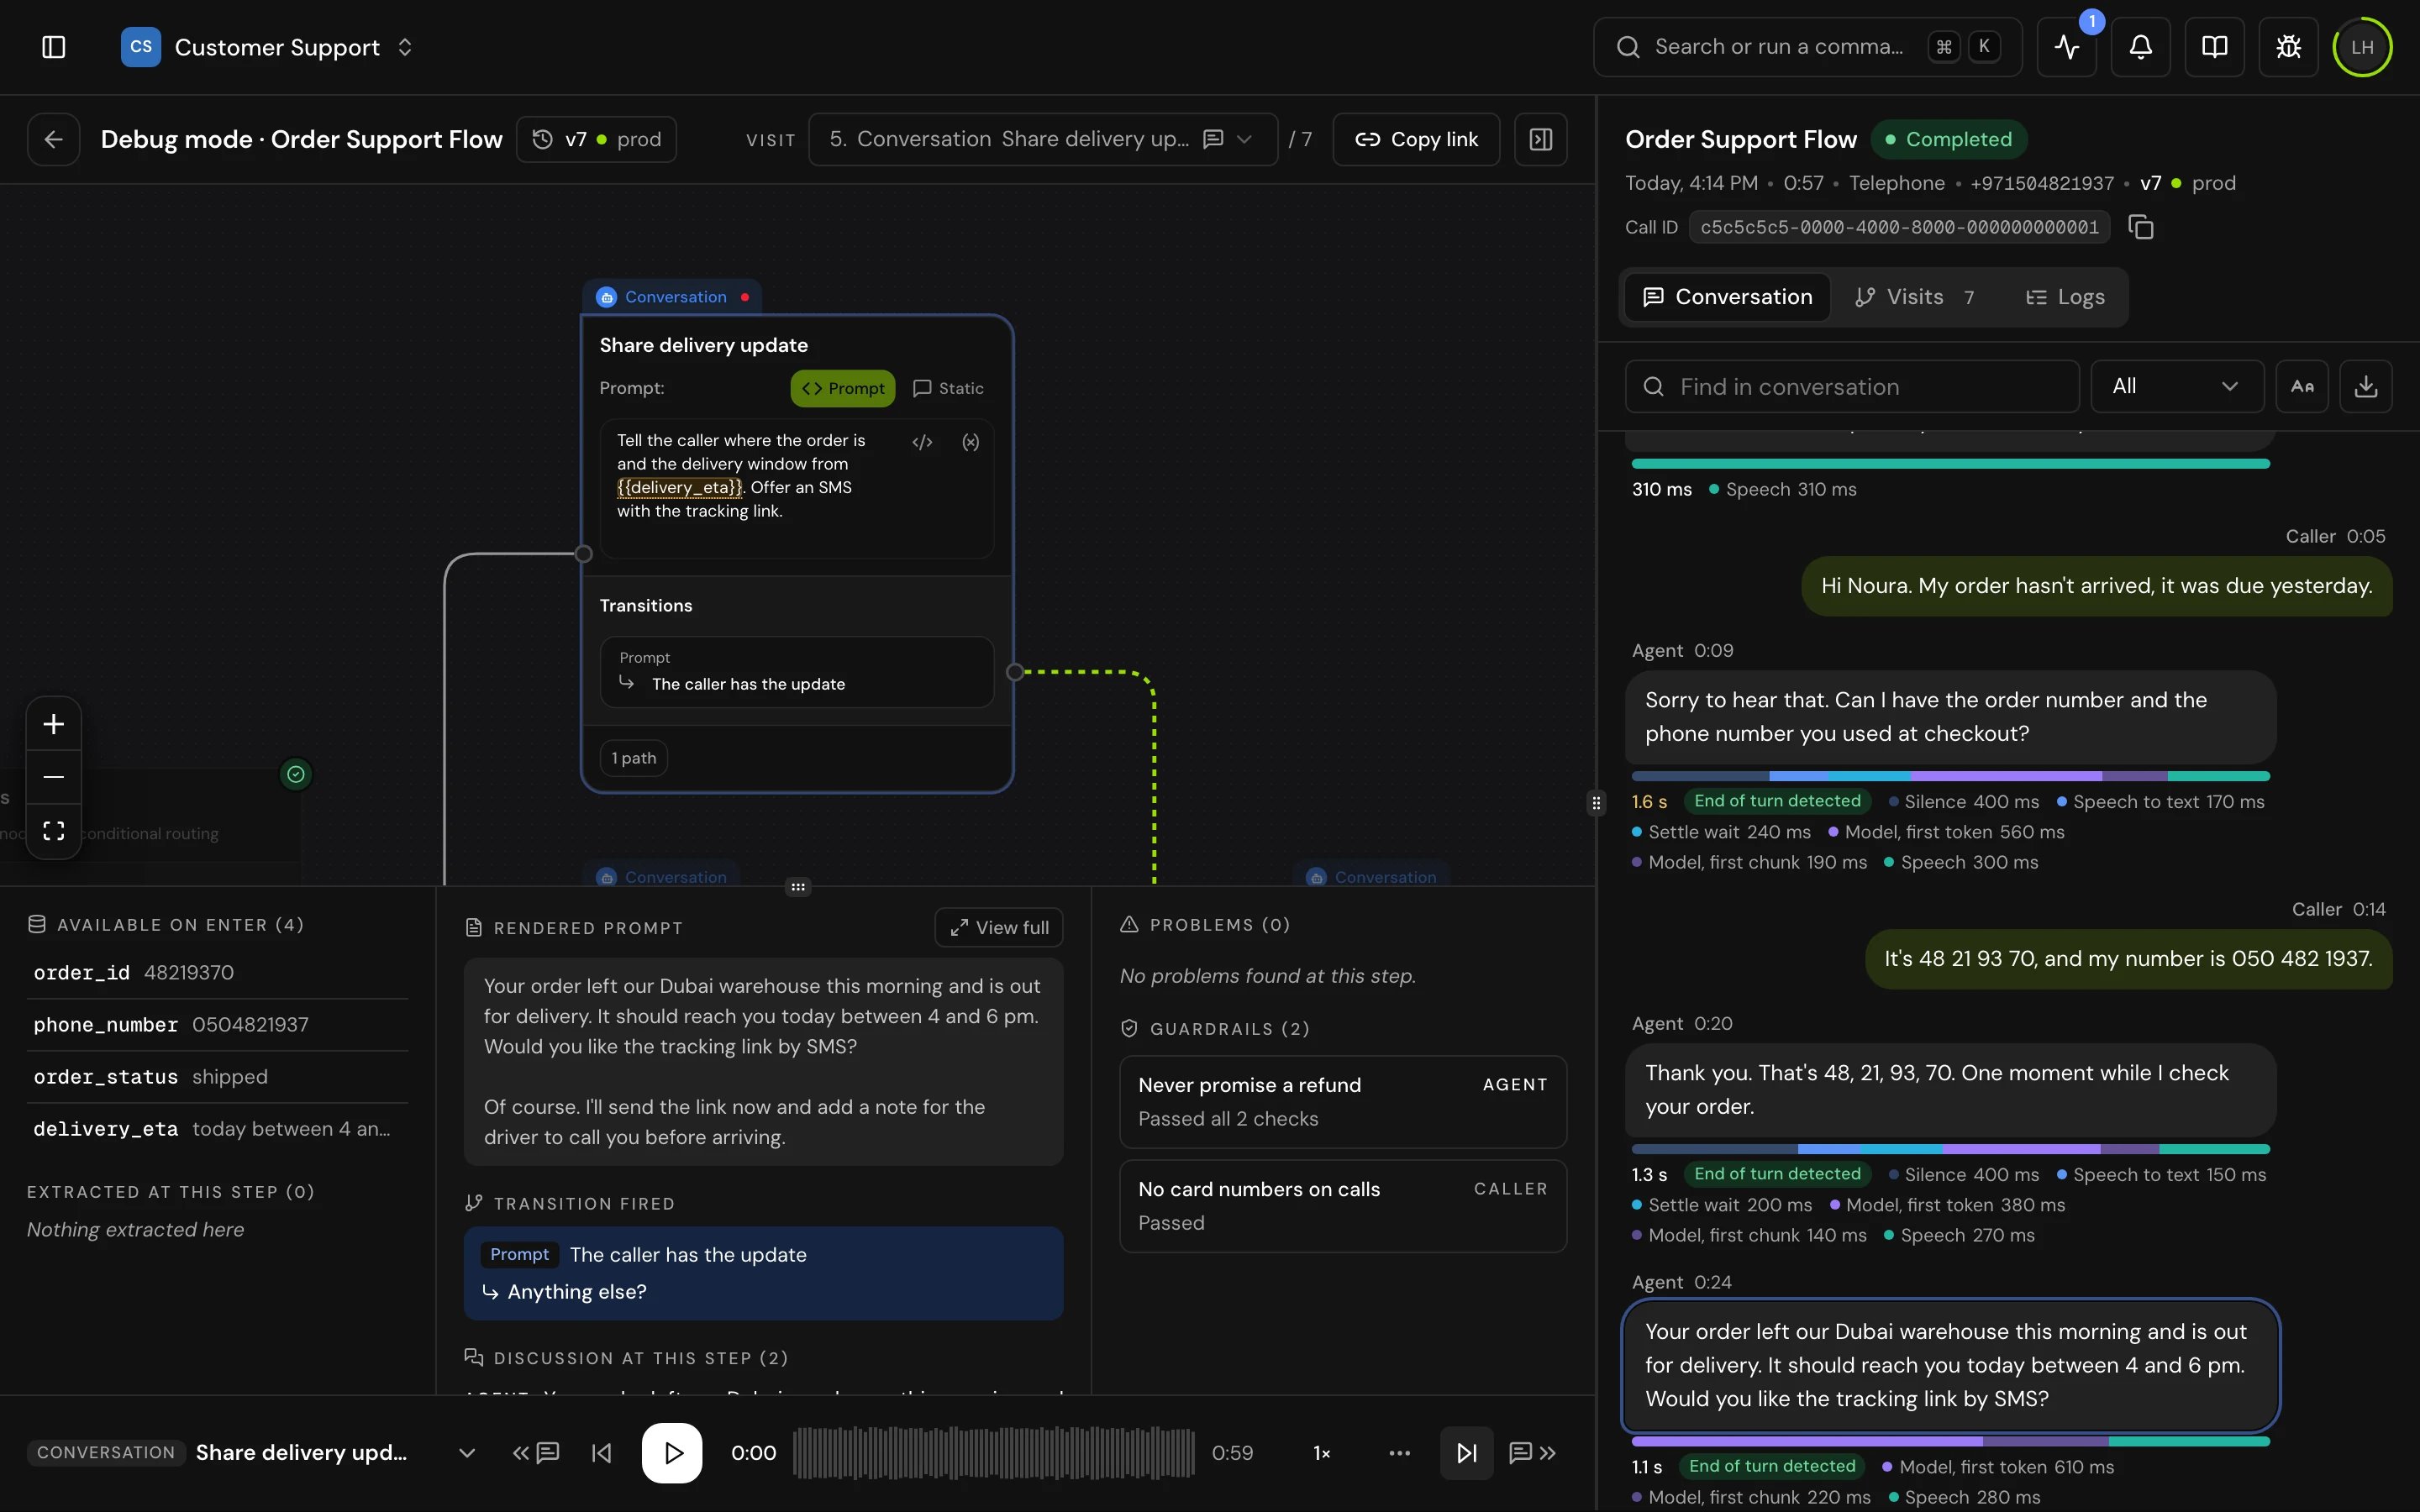
The top bar
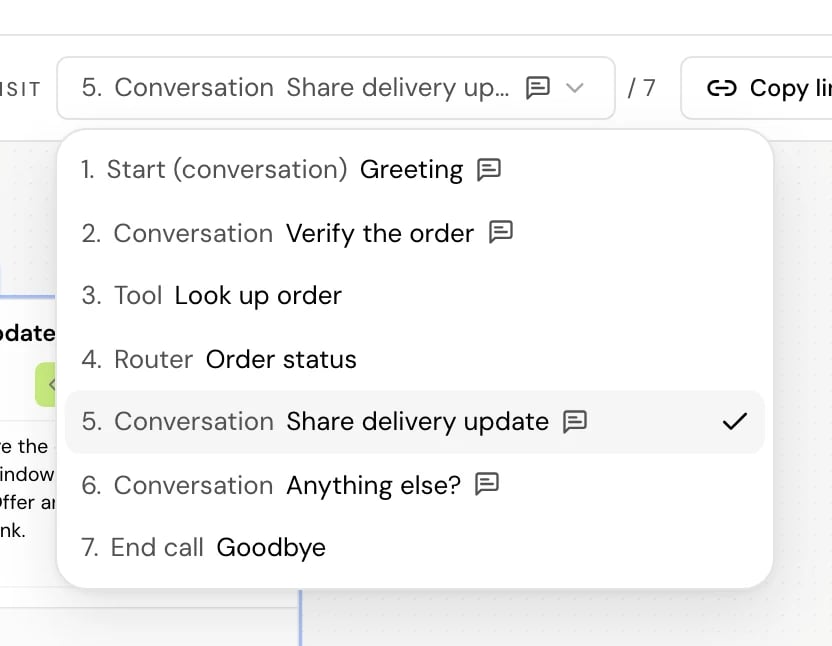
Which flow you see
Debug mode shows the flow as it was when the call ran, not the flow as it is today. The label beside the heading says which:The canvas
The flow keeps the layout you built in the flow builder. During playback:- The step being heard is in focus, and the view moves to keep it in the middle. The rest of the flow fades back.
- The path the call took so far is drawn, and the transition that fired out of the current step is animated in lime.
- Jumps into a global step and back are drawn as dashed, named lines.
- Steps the call visited have a check mark. Steps with problems have a red or amber badge with the number of problems.
The current step’s details
Under the canvas, three columns describe the visit you’re on. Drag the handle above them to give the canvas more room, or click Hide details in the footer to fold them away.Playback
The footer shows the current step’s type, name and any problems, then the controls. Playback always runs left to right, in Arabic too.
Everything moves together: as the recording plays, the canvas, the current visit, the transcript and the logs follow it. Choosing a visit from the Visit menu or with the previous and next buttons pauses the recording at the start of that visit. Clicking a visit card or a line of the transcript moves the recording there, and it keeps playing if it was. Play from here on a log plays from that moment.
The recording is uploaded after the call ends. Until it arrives, the footer says Preparing the recording (“Usually ready a minute or two after the call ends.”) and you can step through the call without it: Play moves through the visits one by one, and Restart starts again from the first. Check now looks for the recording at once. If no recording has arrived 15 minutes after the call ended, the footer says No recording for this call, with Check again. Chat calls have no recording.
The Conversation tab
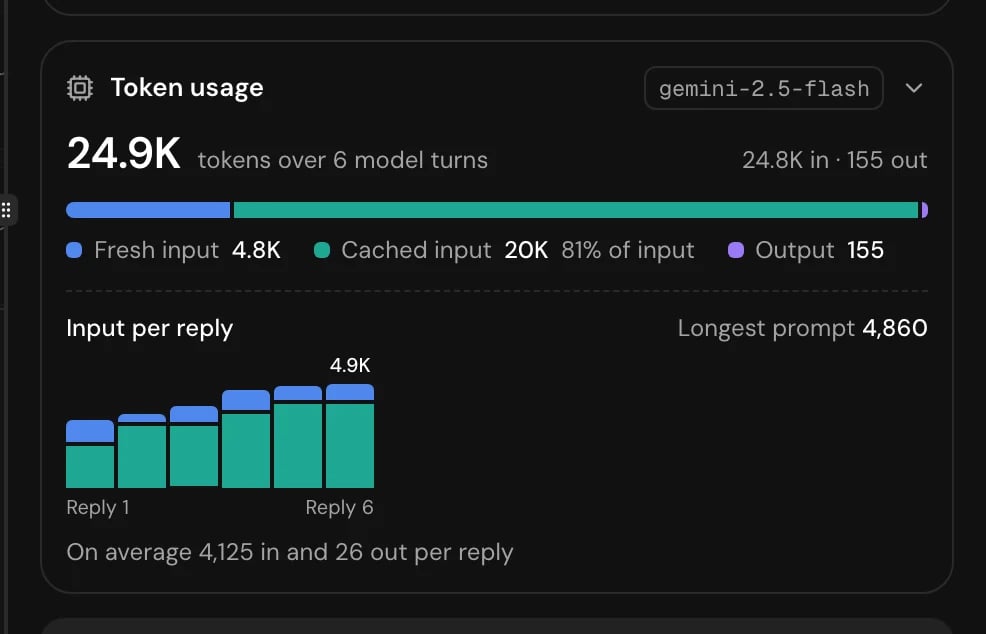
The transcript, with the agent’s lines on the left and the caller’s on the right, each with its time into the call. The line being heard is outlined. Click a line to move the recording to it. Under each agent line, a bar shows how long the reply took and where the time went. Above the transcript:- Reply time and Token usage for the whole call (see Reference). Click a panel’s header to fold it; your choice is remembered on this device.
- Call summary, when the call’s outcome has one.
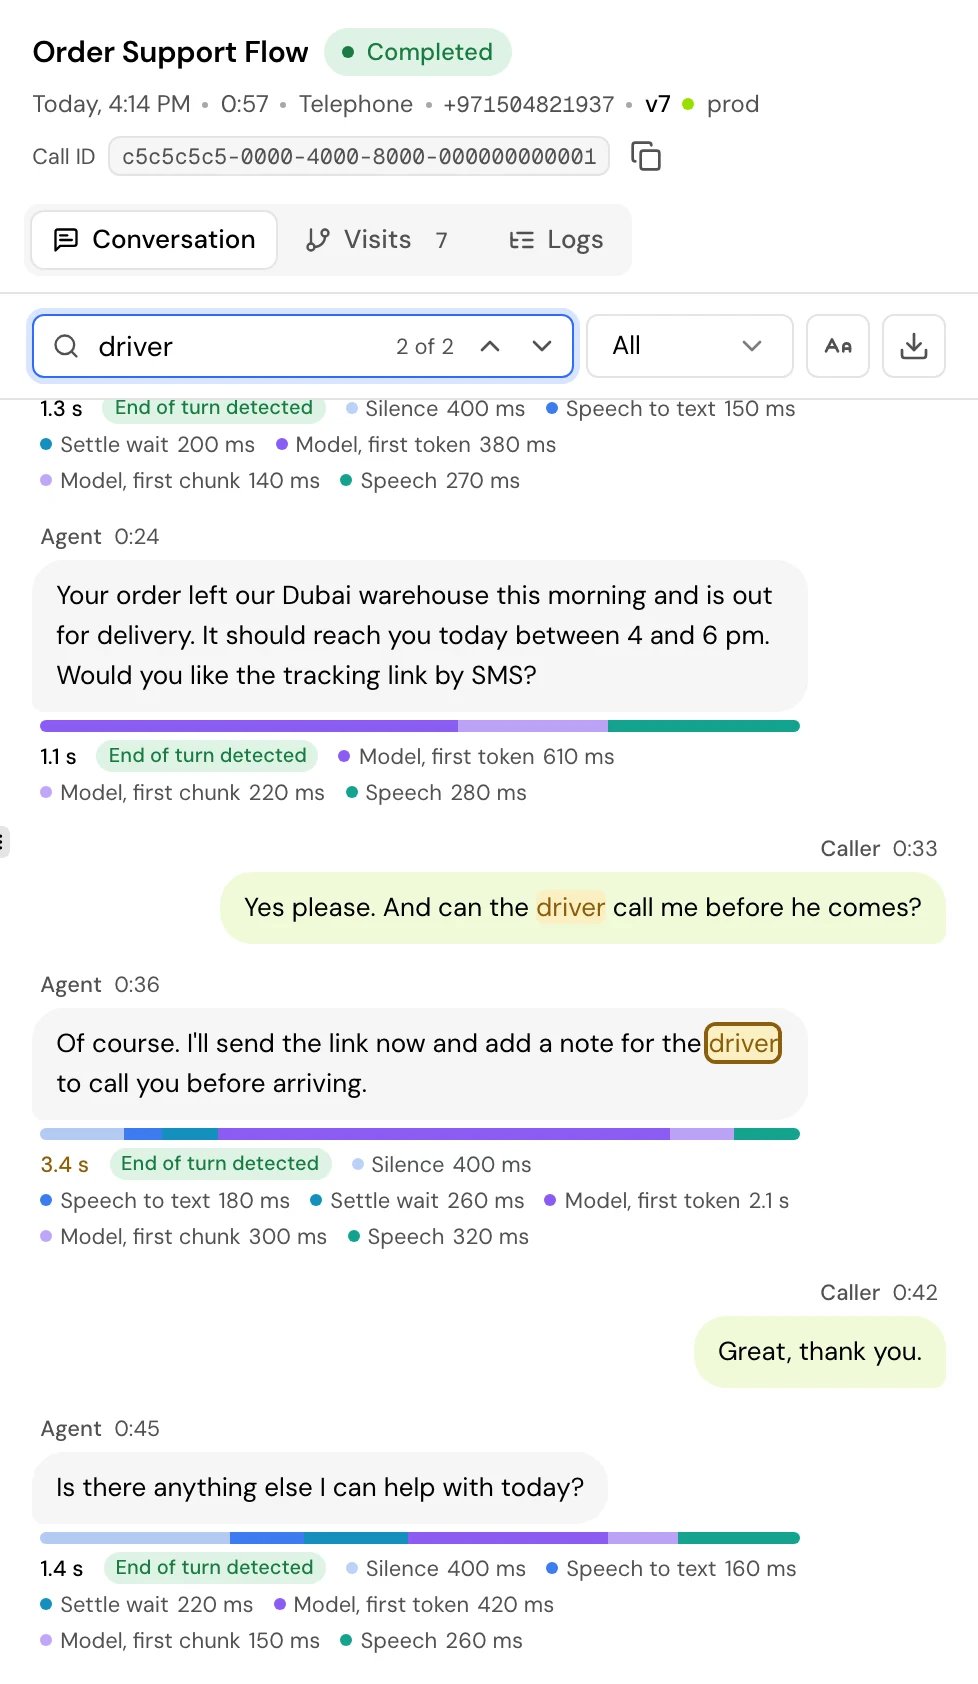
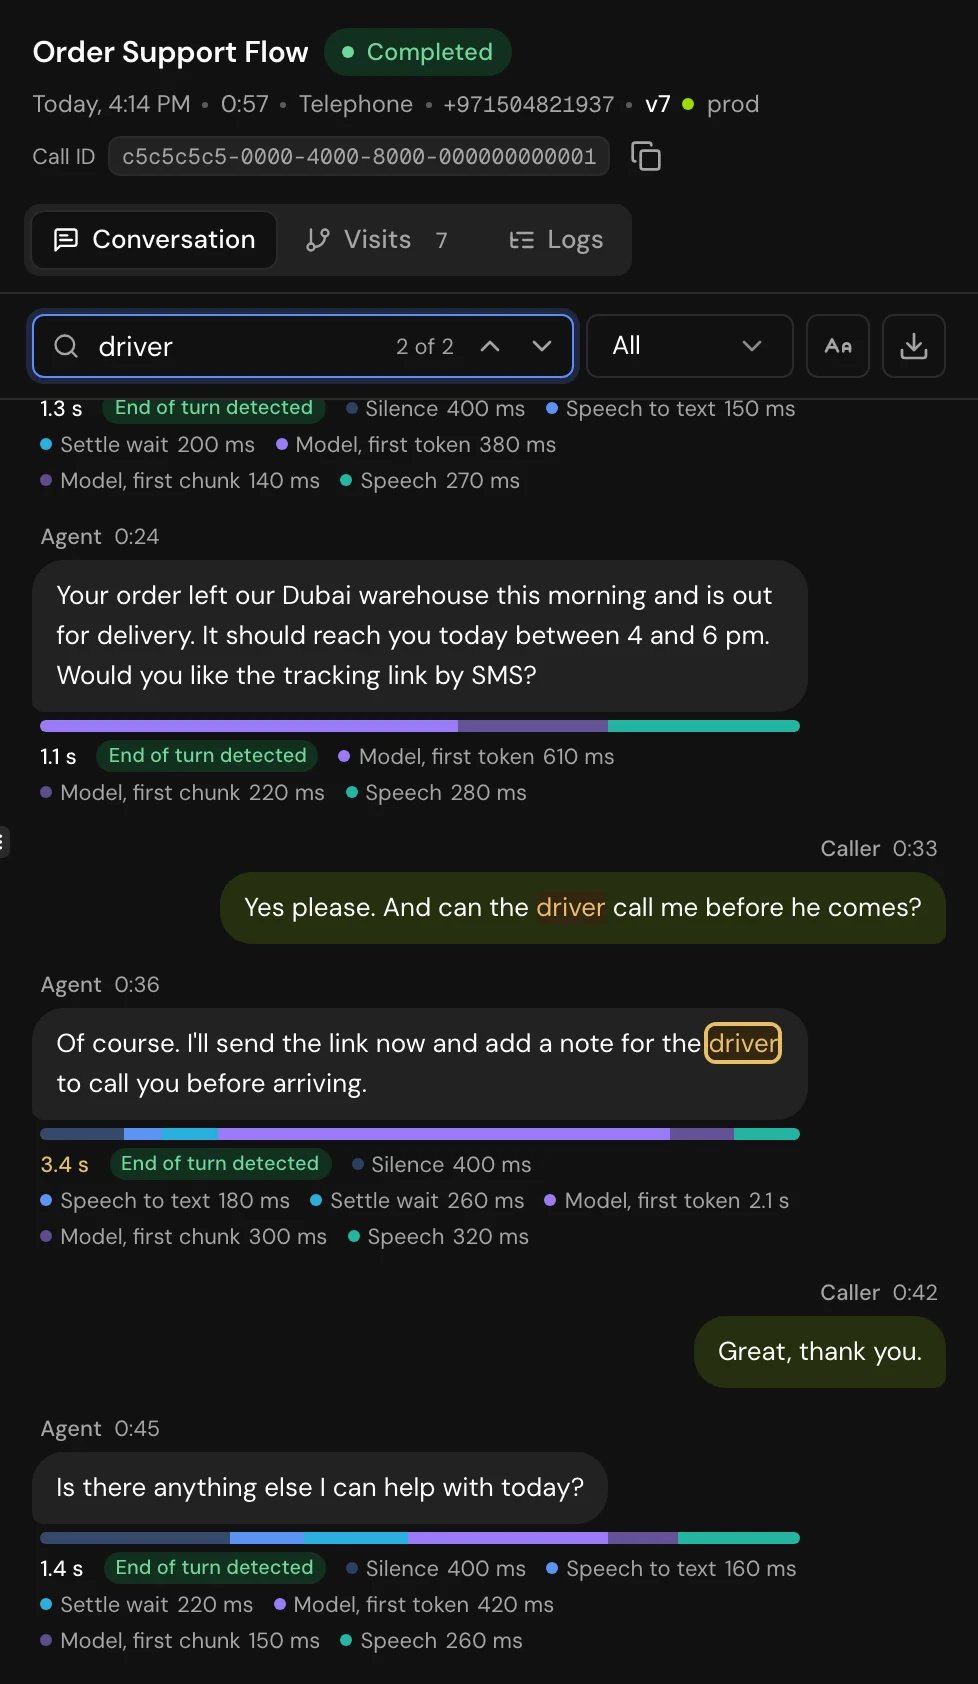
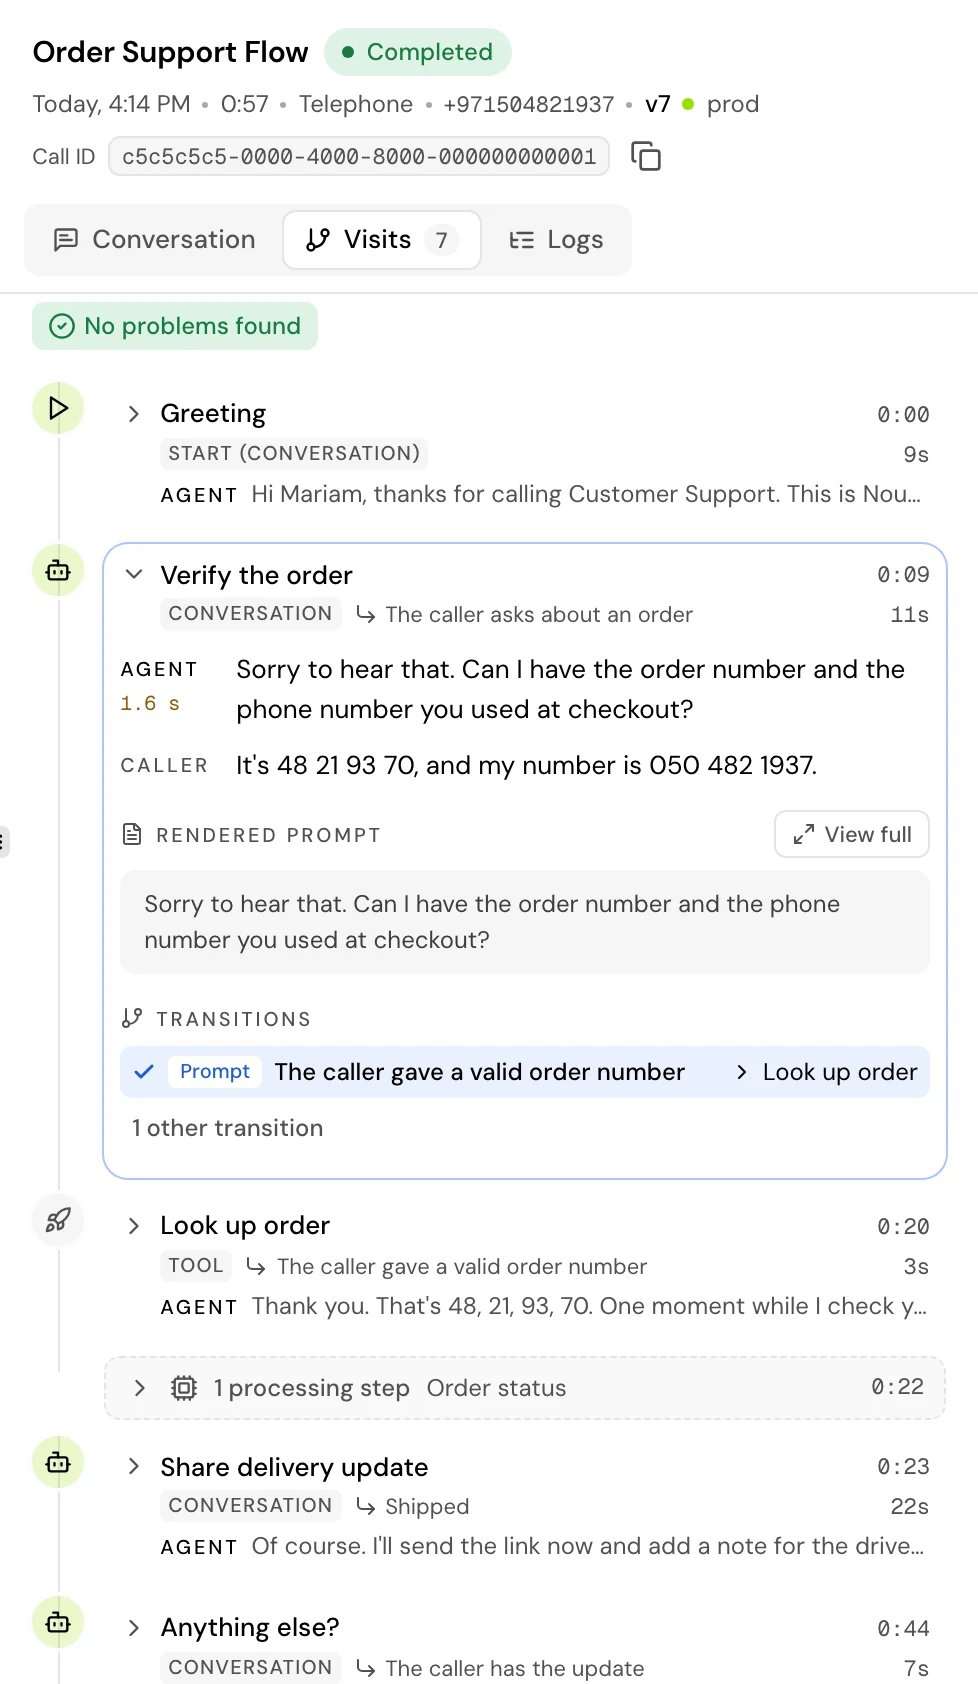
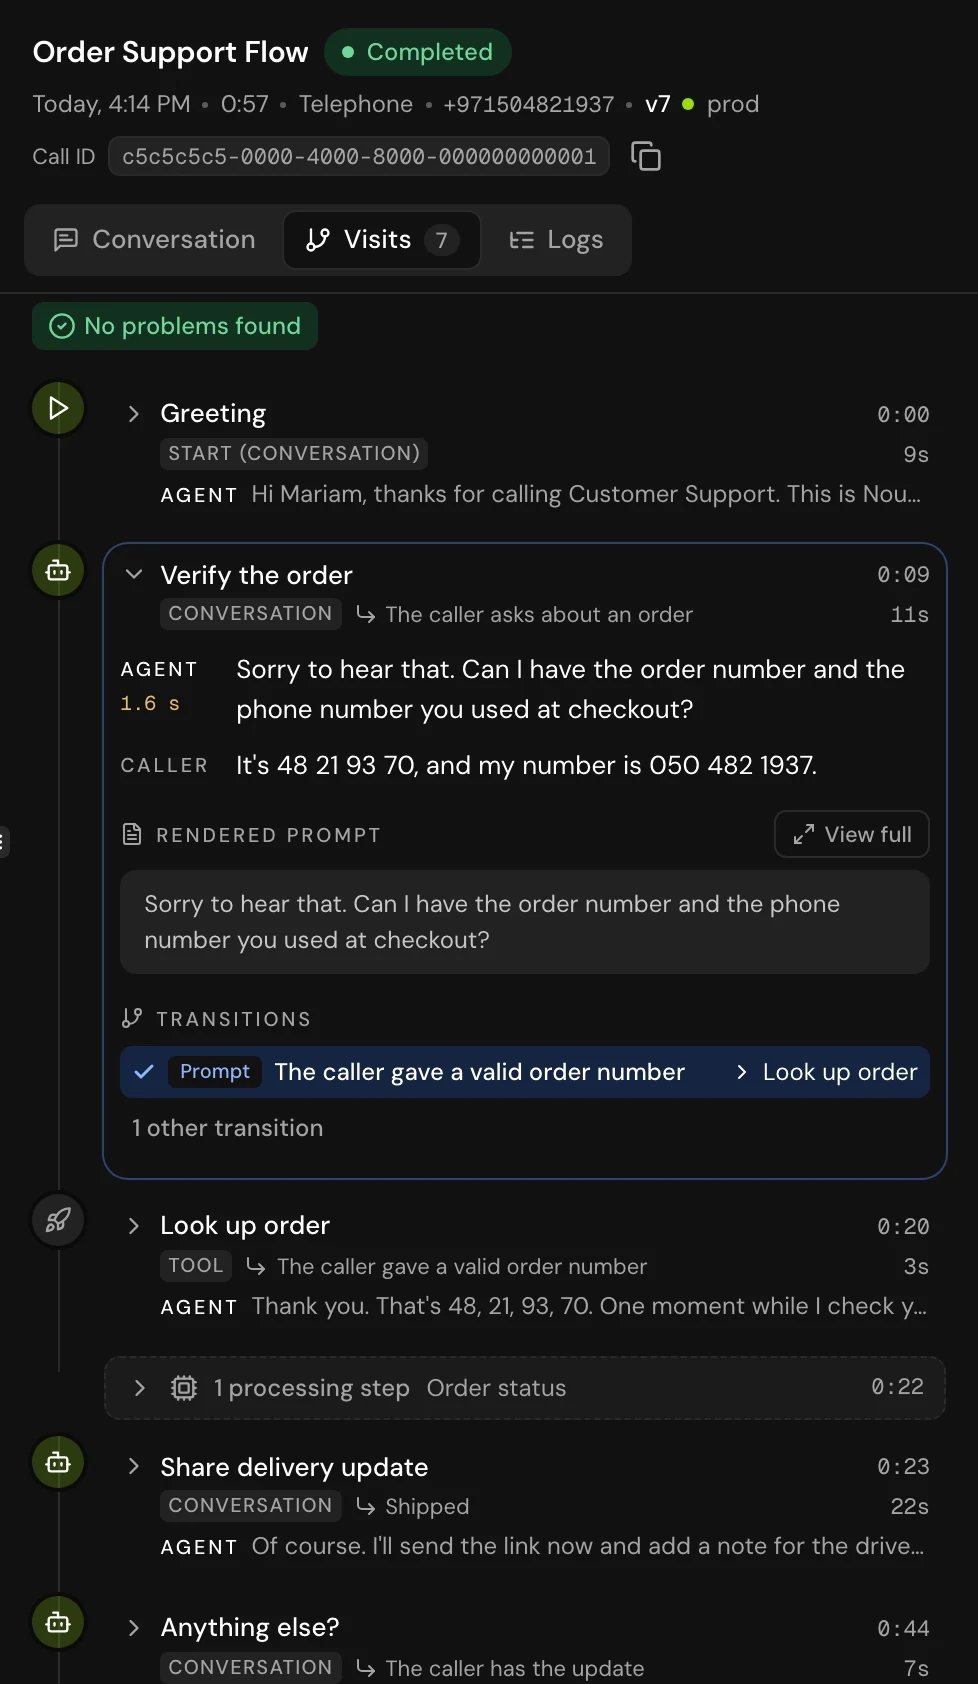
The Visits tab
One card per visit: every time the call entered a step. The tab’s label shows the number of visits, with a red or amber dot when a visit has an error or a warning. At the top, a summary counts the call’s errors, warnings and notes, or says No problems found.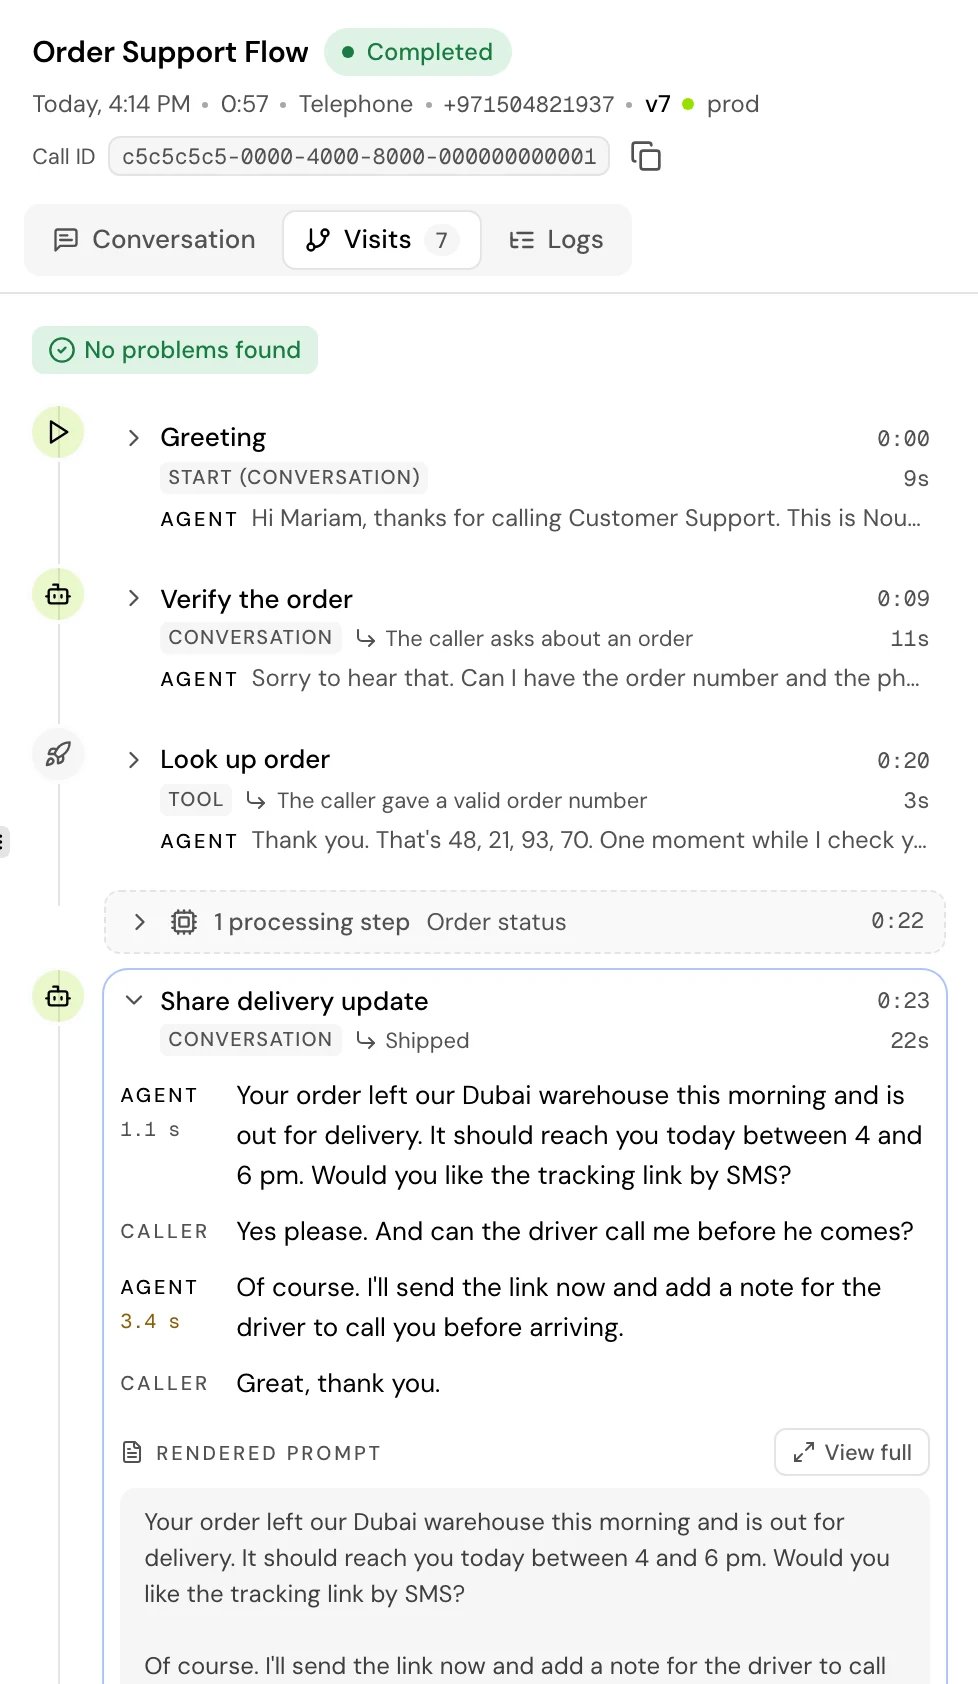
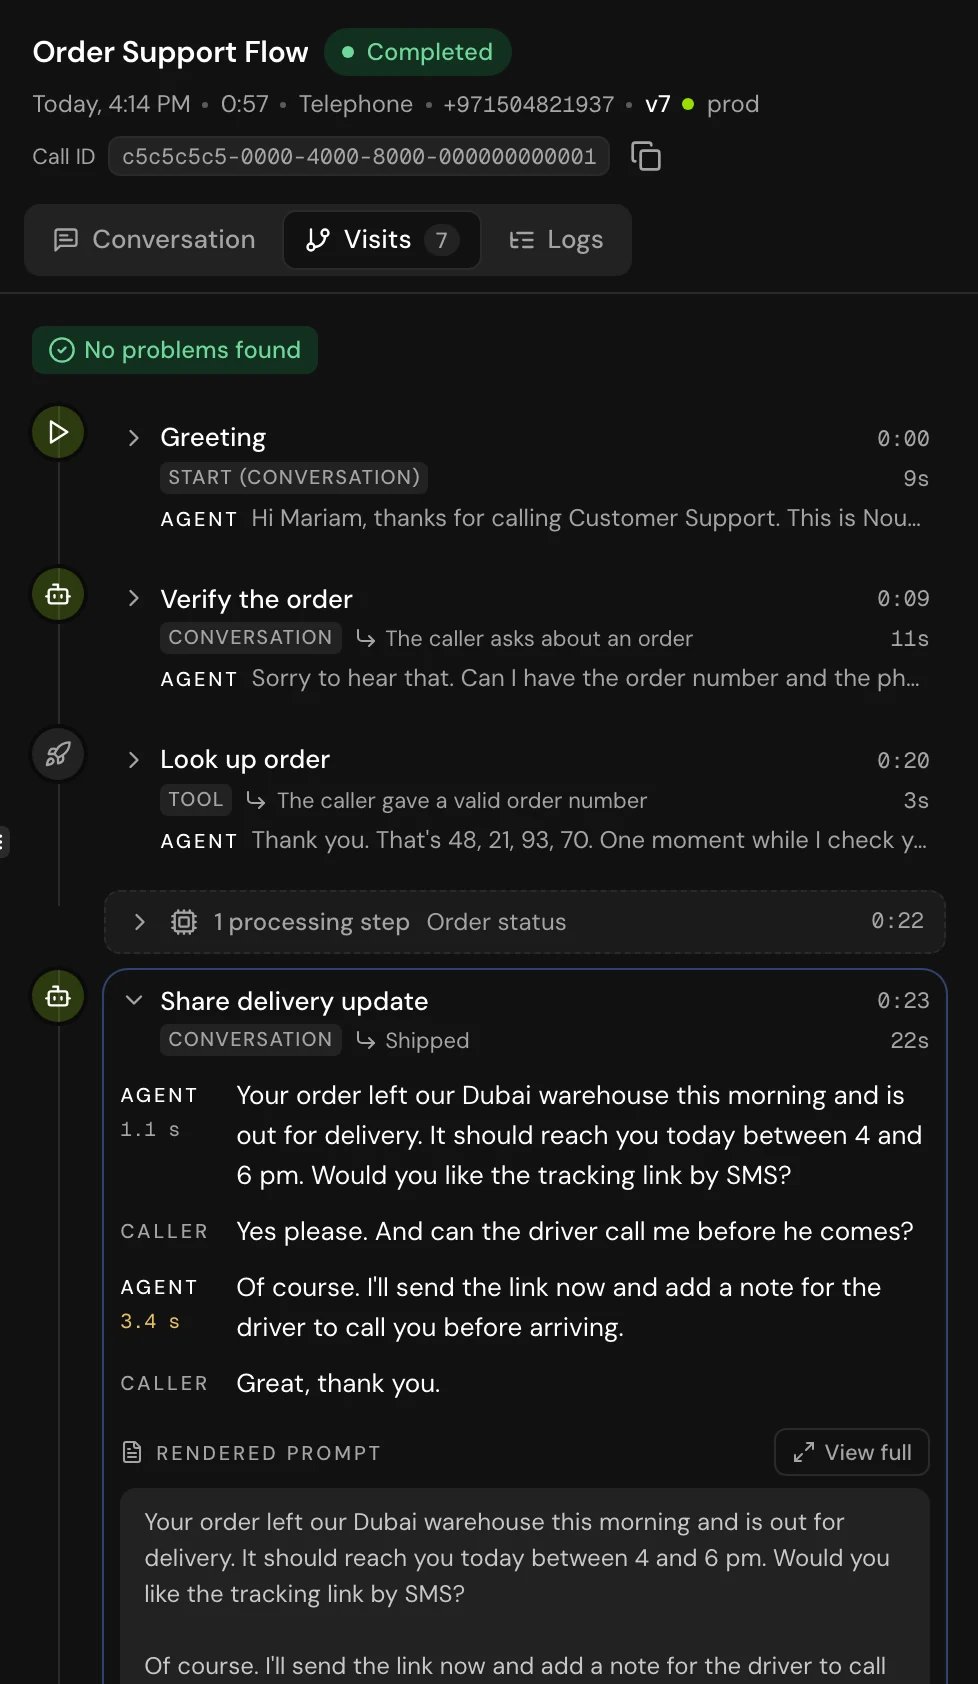
- Its problems, each with what happened (see Problems).
- What was said there, with each agent reply’s time. Slow replies (over 1.5 seconds) are amber.
- Settings changed here, for a Change settings step: the voice, the language, or the New system prompt.
- The prompt: Rendered prompt, Processing message or Original prompt (template). View full shows all of it.
- The tool’s API call and the call Transfer, when the step had them.
- Extracts: each variable the step extracts. Green shows the value; amber “(missing)” means a required variable wasn’t extracted. Hover a chip for the value and the extraction prompt; click it for the full value.
- Transitions: the one that fired, checked and highlighted, and any that lead nowhere. “N other transitions” shows the rest, global ones included.
The Logs tab
Every event the call logged, in order, with a summary of the call above them: turns (agent and caller), steps, variables, average reply, tools (and how many failed), average tool time, routes, transfers, errors and warnings.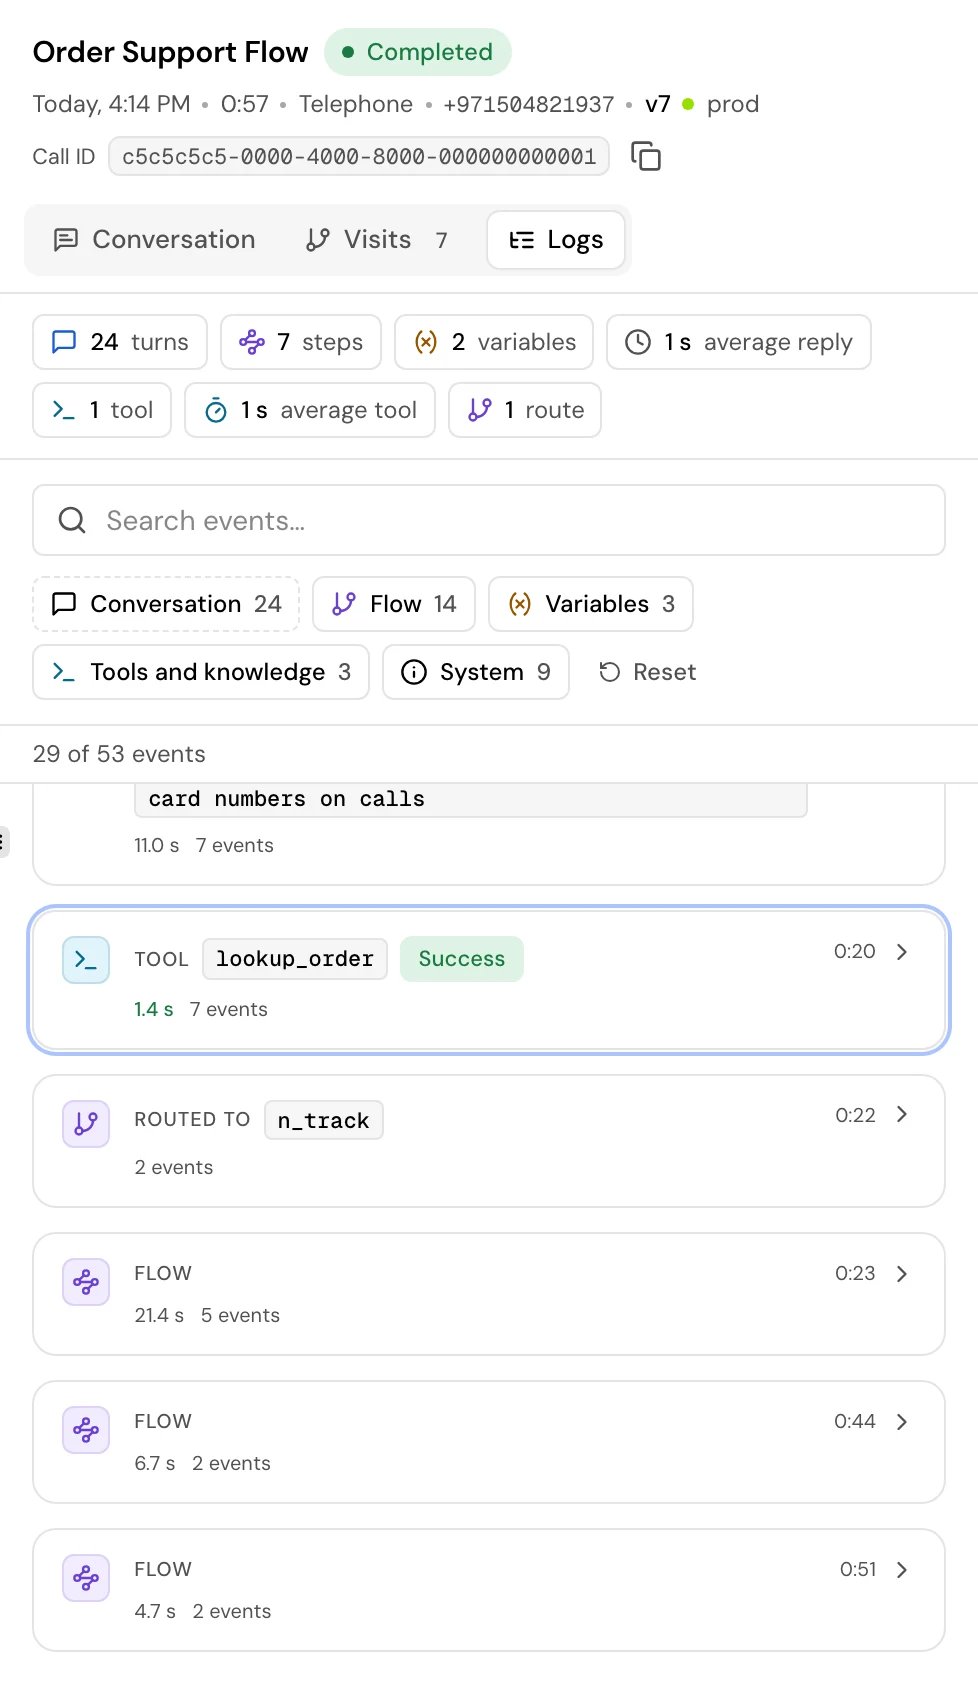
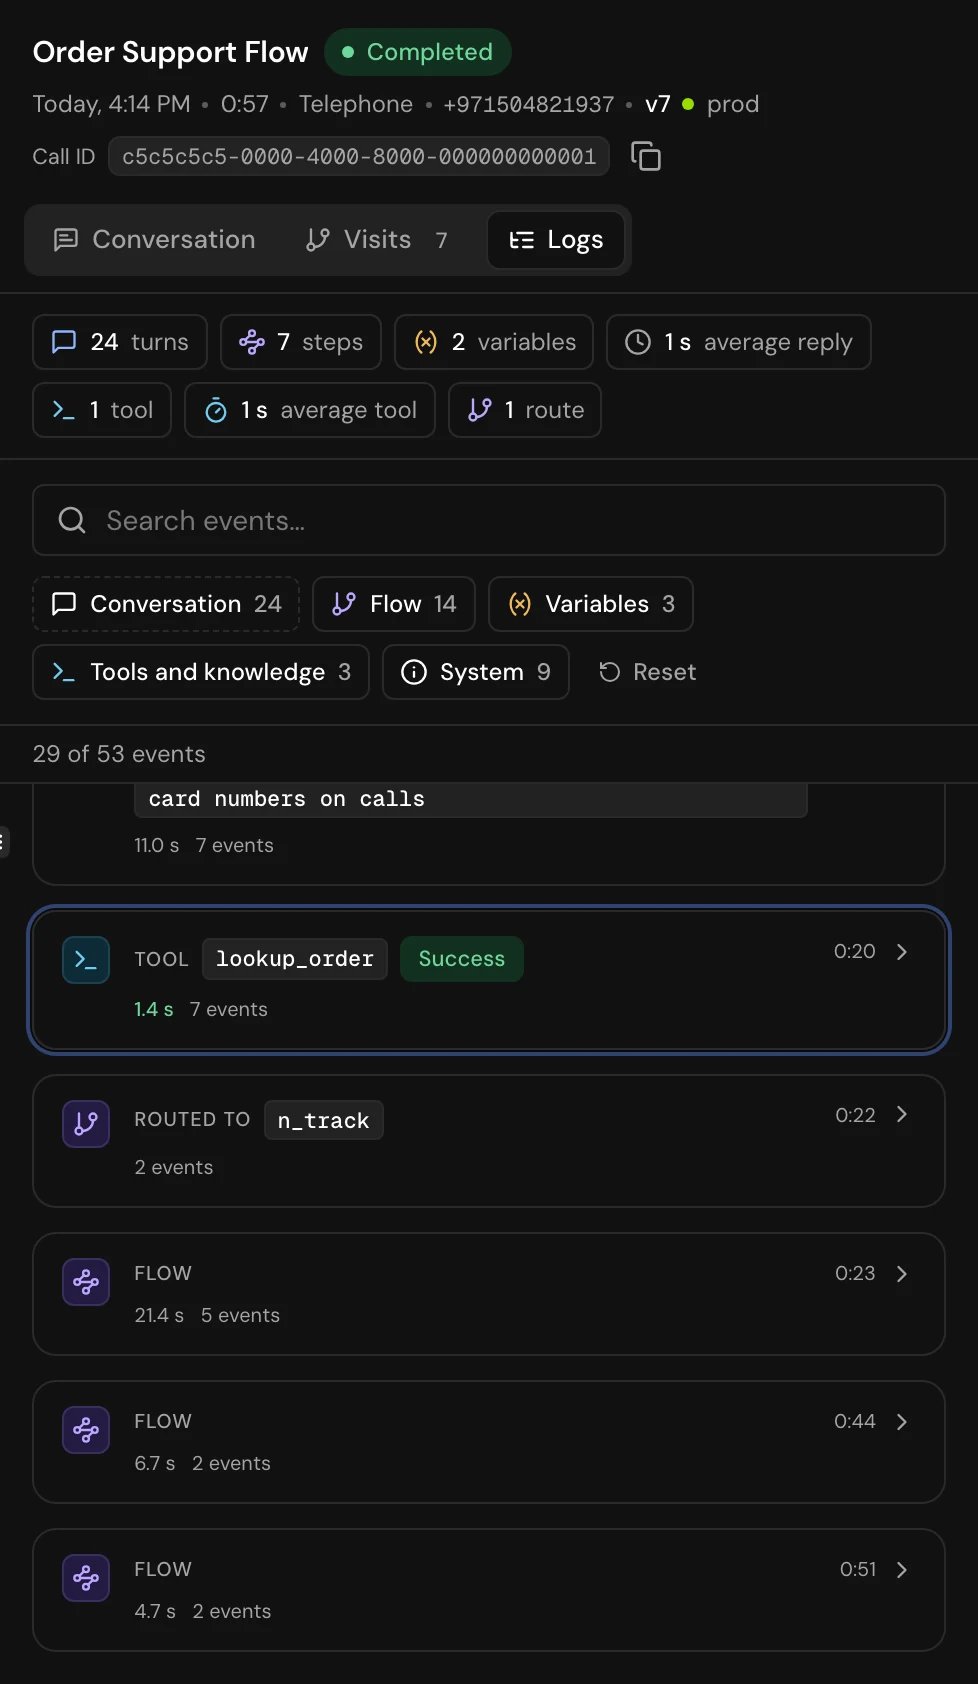
Events that happen in a row at the same step are grouped into one card with a short summary; click it to see them. Errors and warnings have a red or amber icon. As the recording plays, the list scrolls to the event at the current moment.
The kinds of events:
Find why a call took a wrong turn
1
Find the step where it went wrong
Open the Visits tab and read down the cards, or press Next conversation step to hop between the steps where the agent and the caller talked. Cards with problems are already open.
2
Check the transition that fired
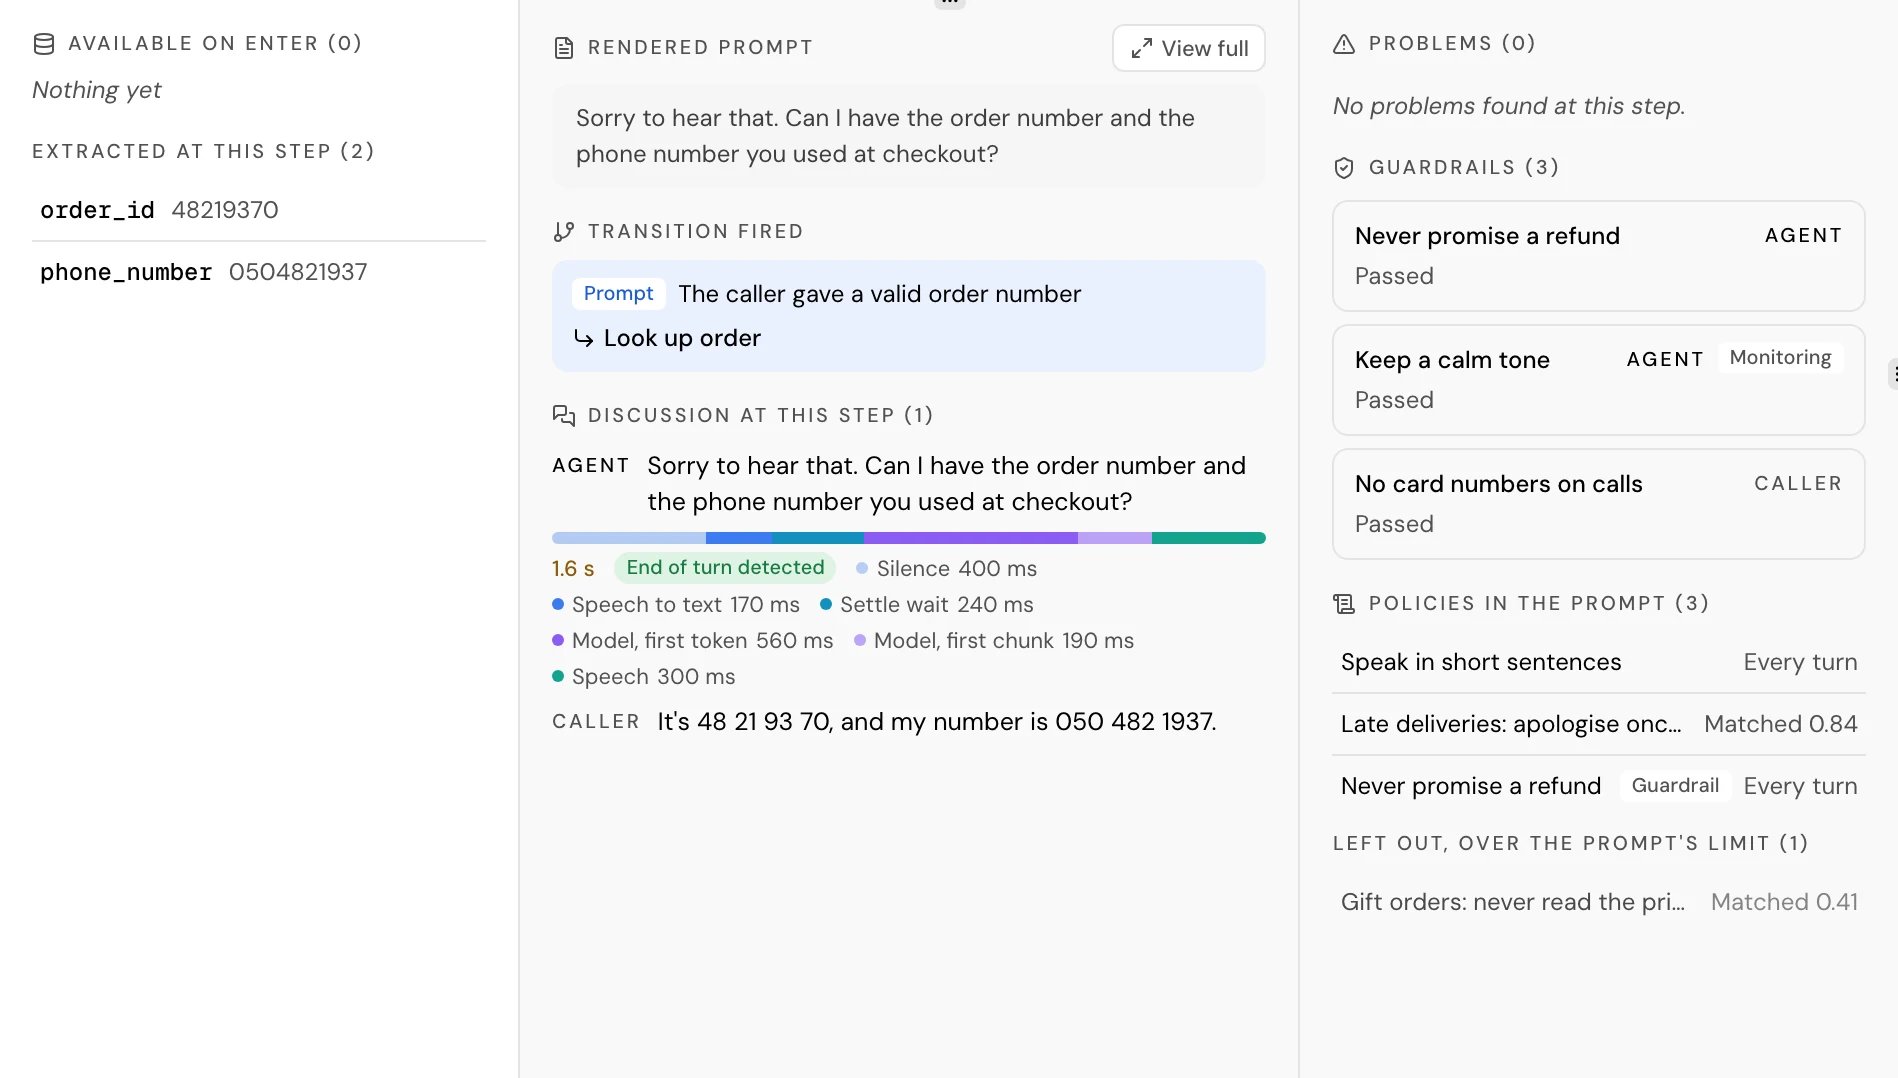
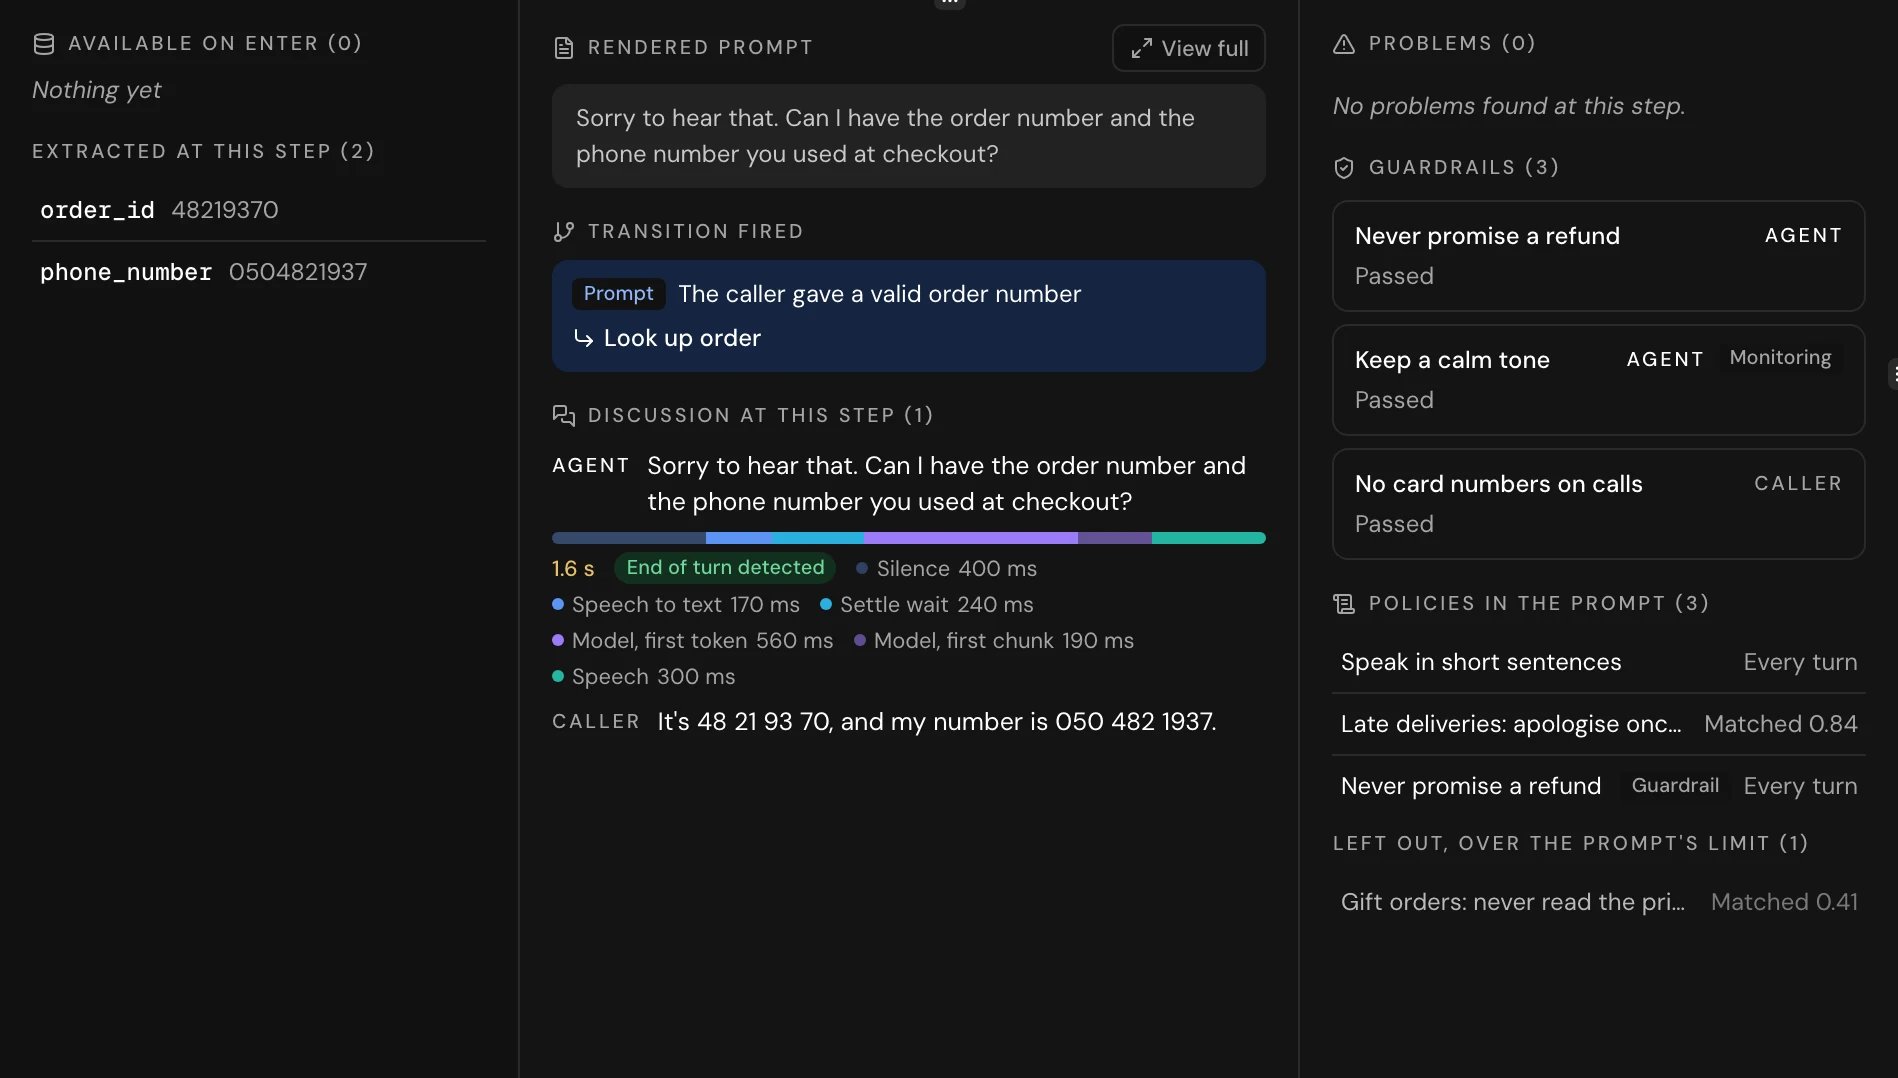
Under the canvas, Transition fired shows the condition and the step it led to. On the visit card, Transitions shows the one that fired and “N other transitions” lists the ones that didn’t.
3
Check the variables
Available on enter shows the values the step had to work with. A wrong or missing value there often explains an Equation transition or a router taking the wrong path.
4
Read what the caller said
Discussion at this step shows the exchange the model judged the transition on.
Check what the model saw at a step
Go to the visit and look at the prompt in the step details or on its visit card. Its heading says which text you’re reading:
Then check Policies in the prompt (N) in the third column: the policies added to the model’s prompt at this step. Each says “Every turn” (added on every turn) or “Matched” with a score (added because the caller’s words matched it). Guardrail marks a guardrail’s instructions. “Left out, over the prompt’s limit” lists policies that matched but didn’t fit. See Policies and guardrails.
Guardrails (N) lists the guardrails checked at the step, the tripped ones first:
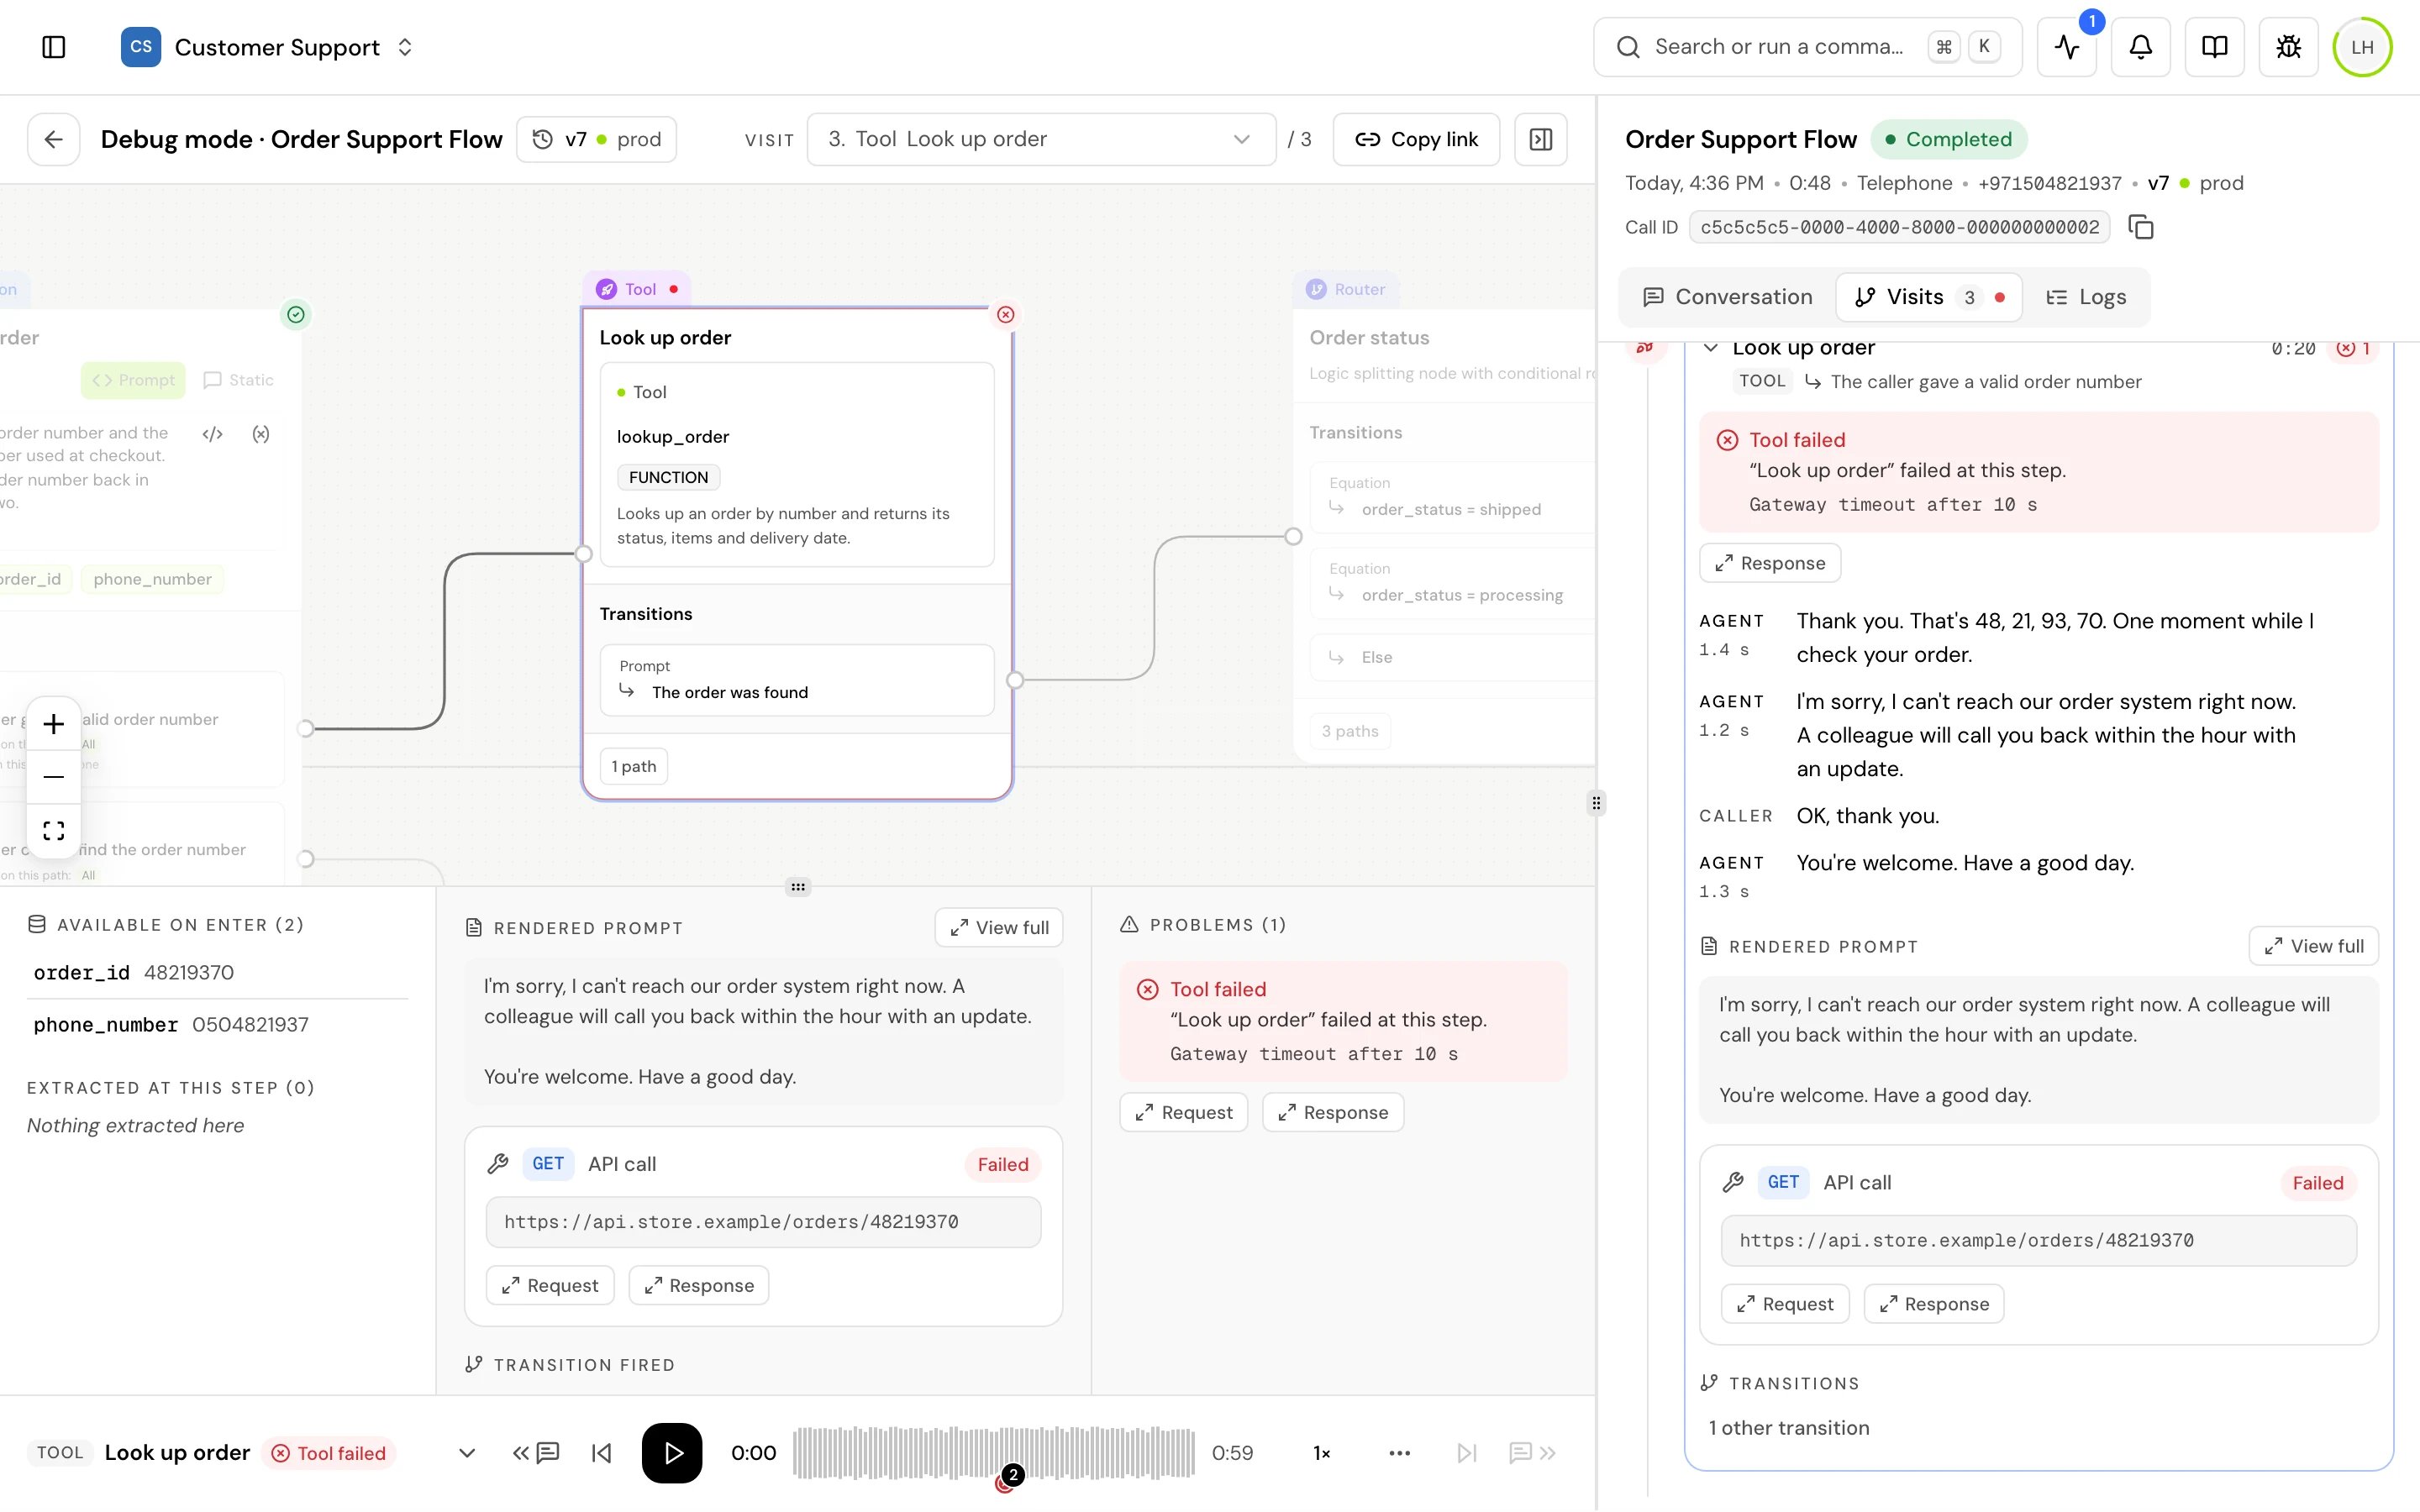
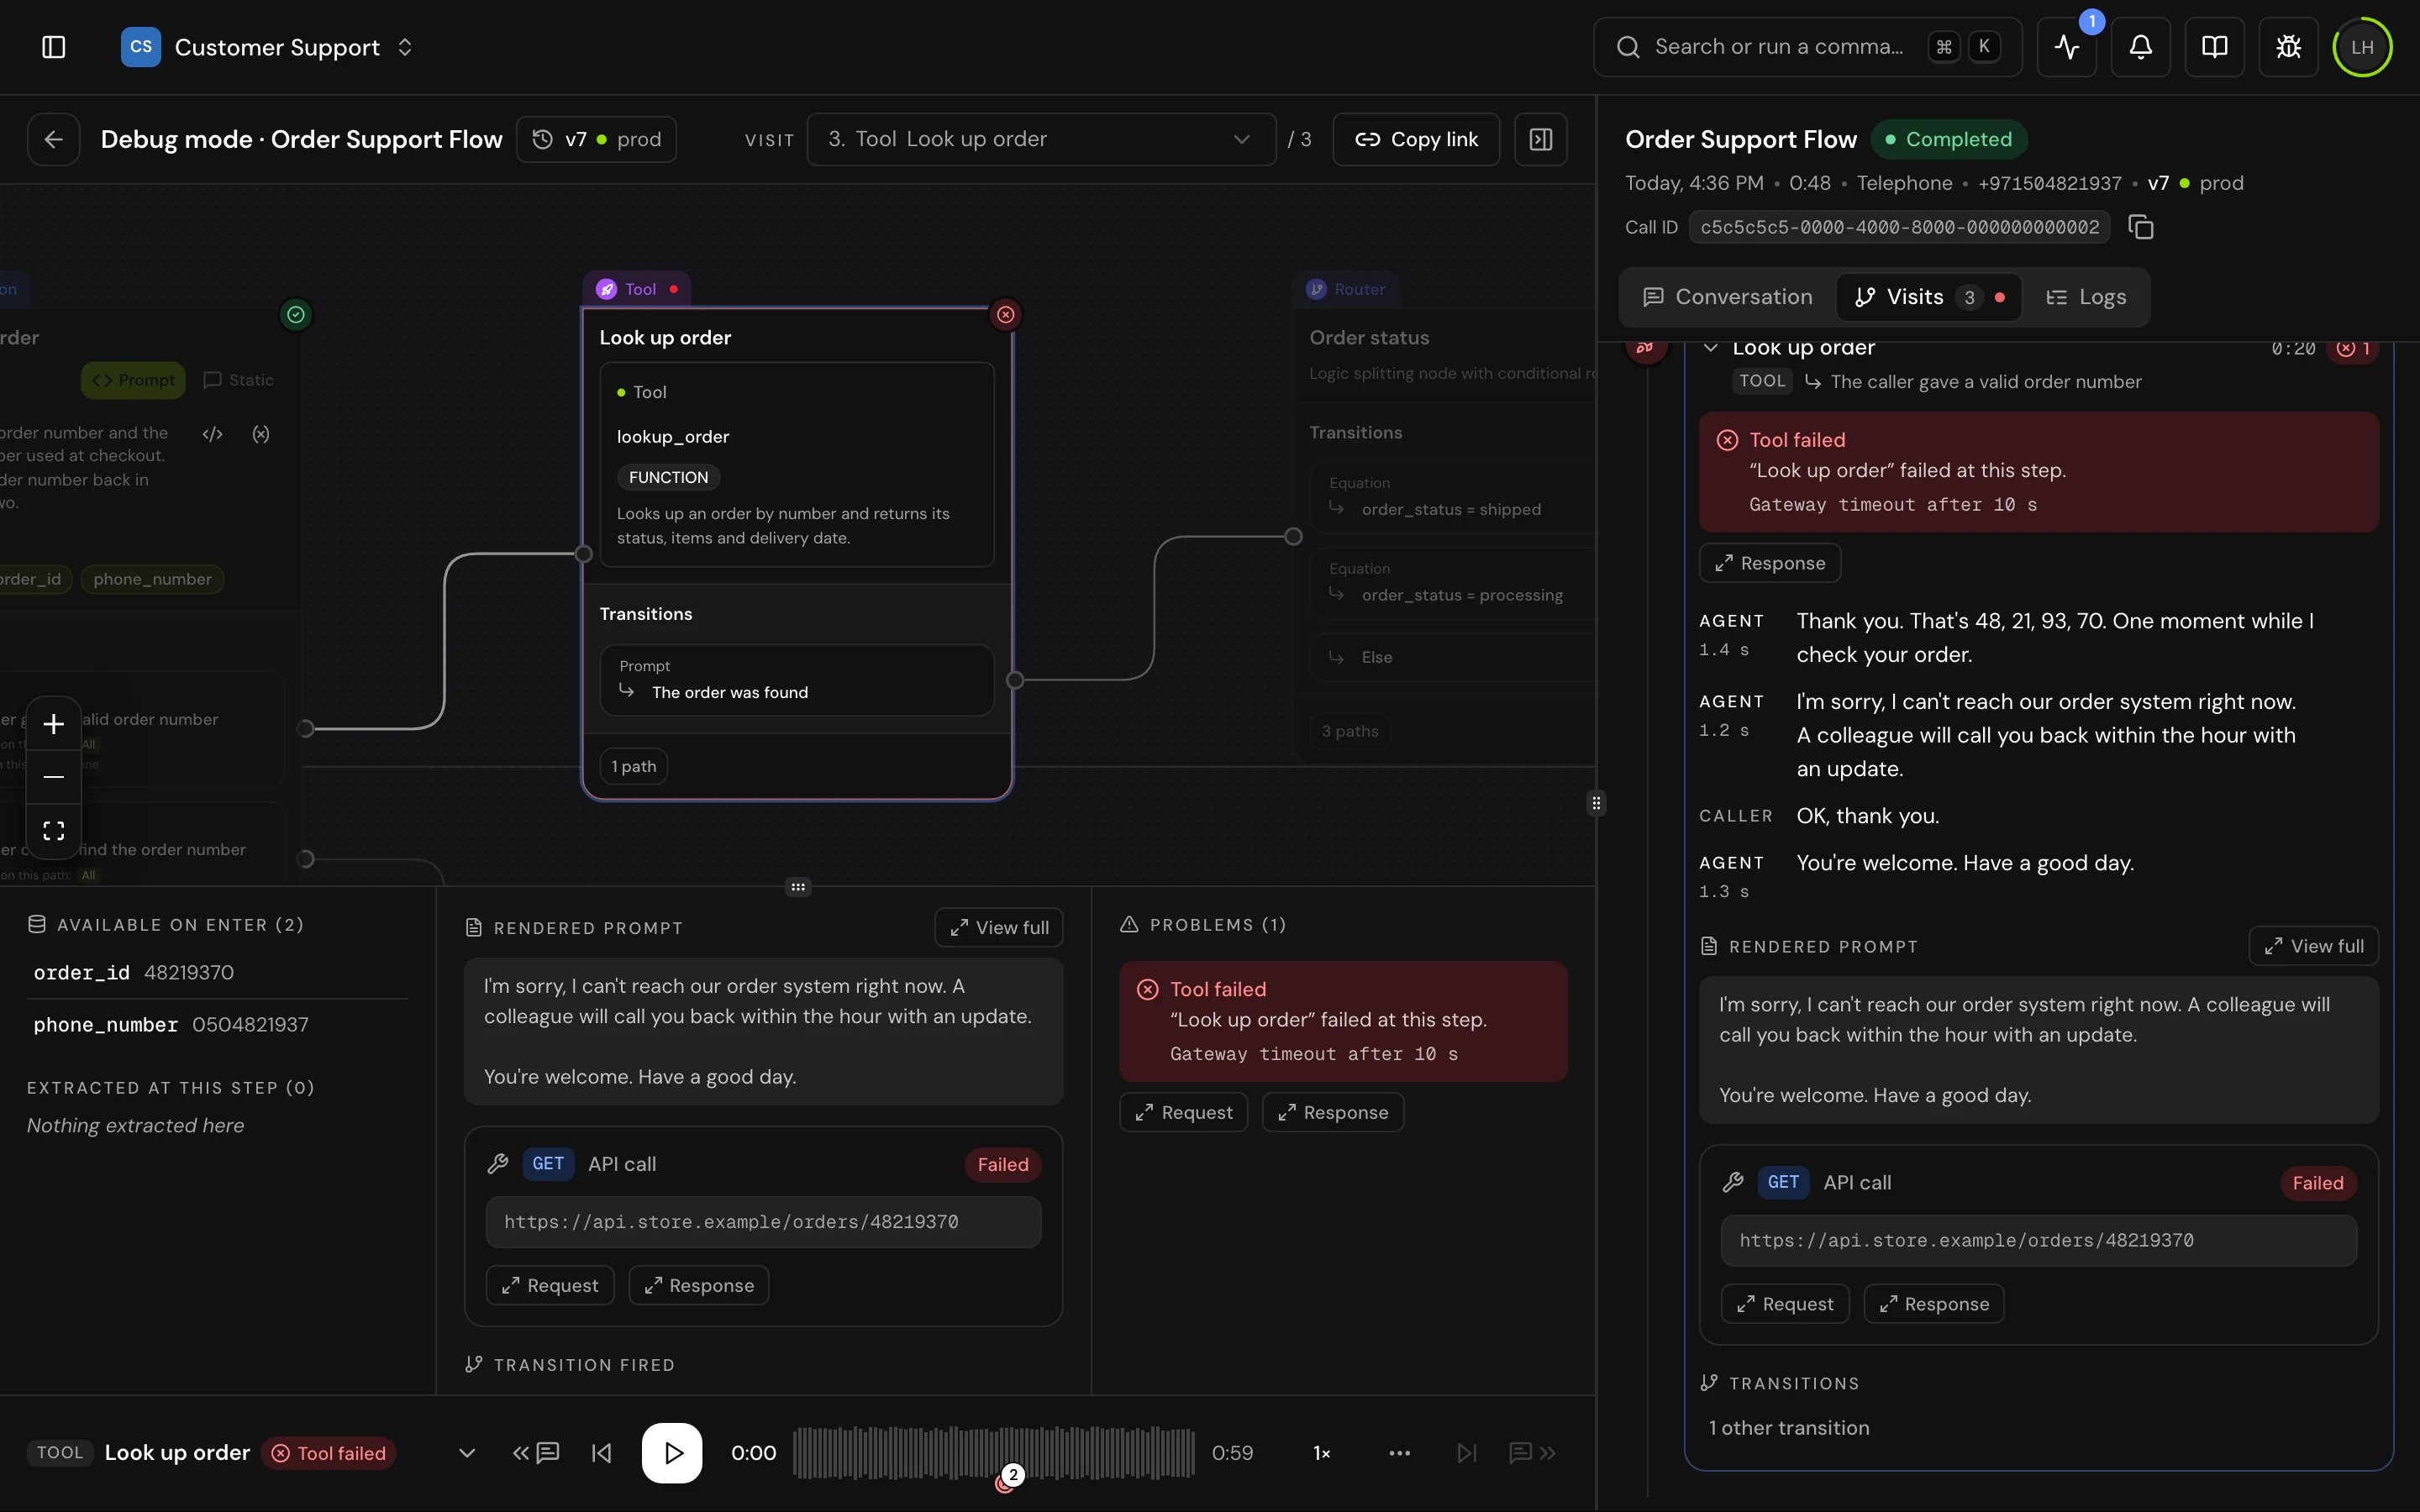
Check a tool call
1
Go to the tool's visit
Choose the Tool step from the Visit menu, or click its card on the Visits tab.
2
Read the API call card
It shows the method, the address that was called, and the result: OK, Failed, or Ran when no result was logged.
3
Open the request and the response
Request shows what was sent, Response what came back. Arguments shows the values the tool was given when no request was logged.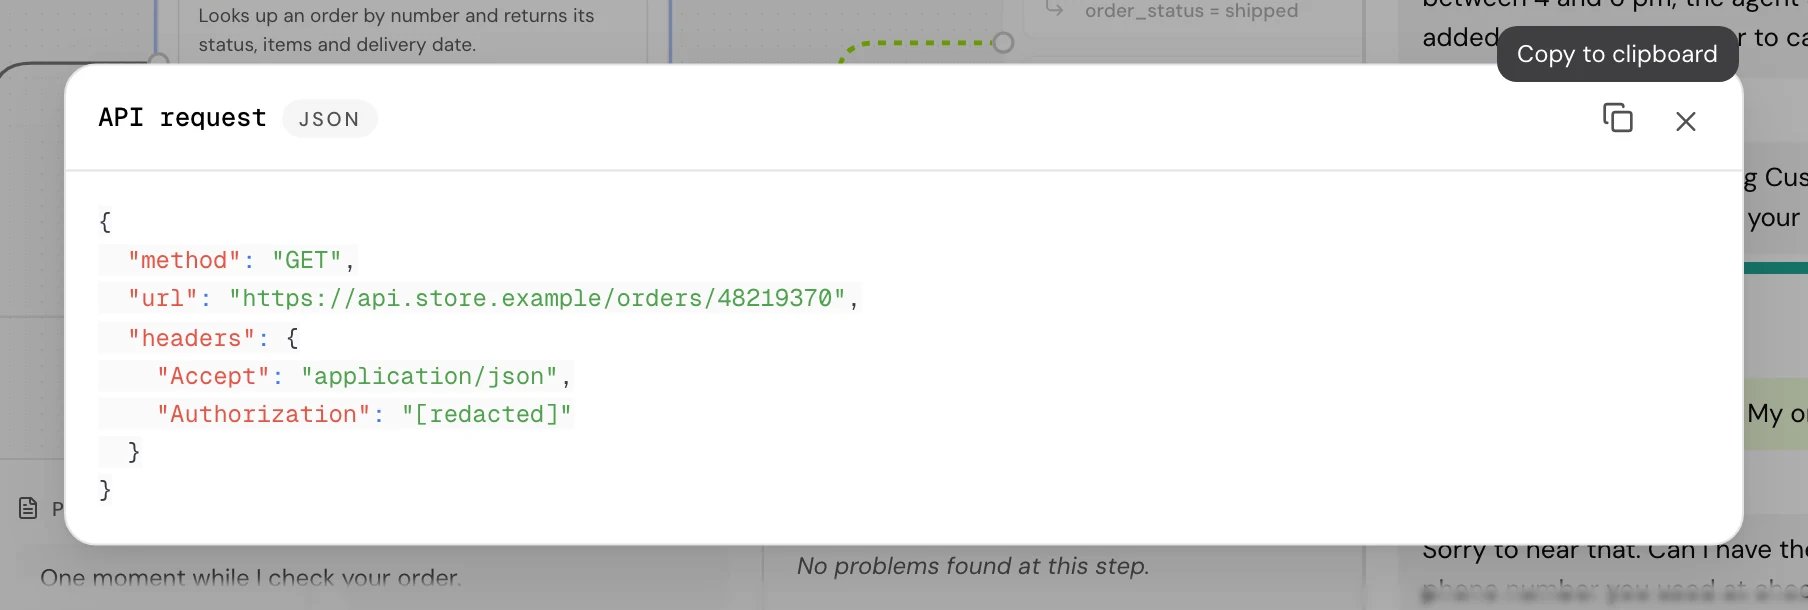
4
Check what it set
Extracted at this step lists the variables the tool’s response set, and the next visit’s Available on enter shows them in use.
[redacted].
When the tool failed, the visit has a Tool failed problem with the error, and Response opens the error the API returned.
Find slow replies
1
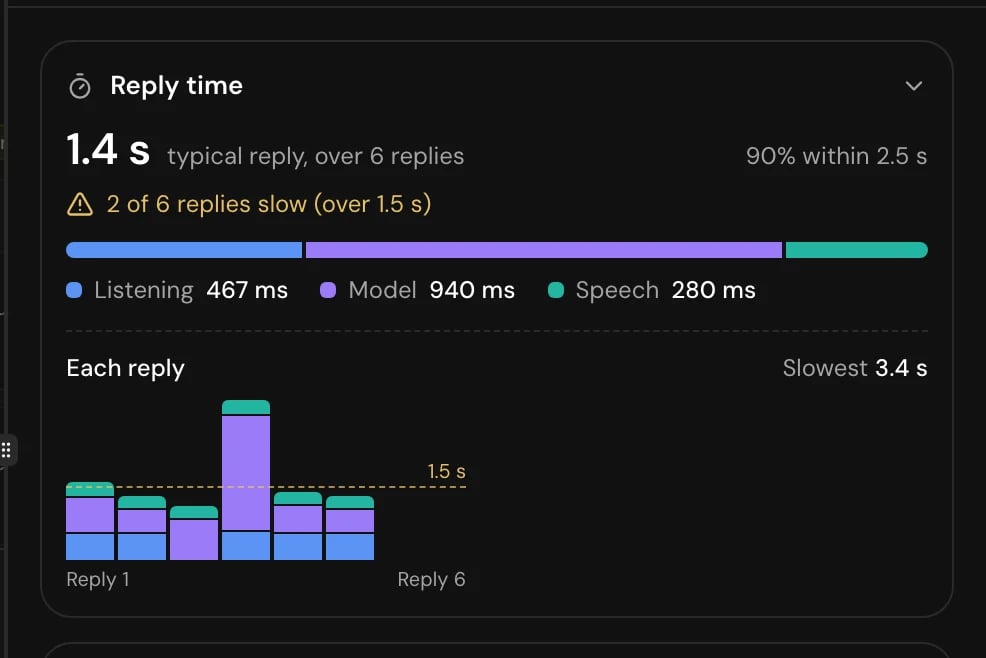
Read the Reply time panel
At the top of the Conversation tab: the typical reply, “90% within” a time, and how many replies were slow (over 1.5 seconds).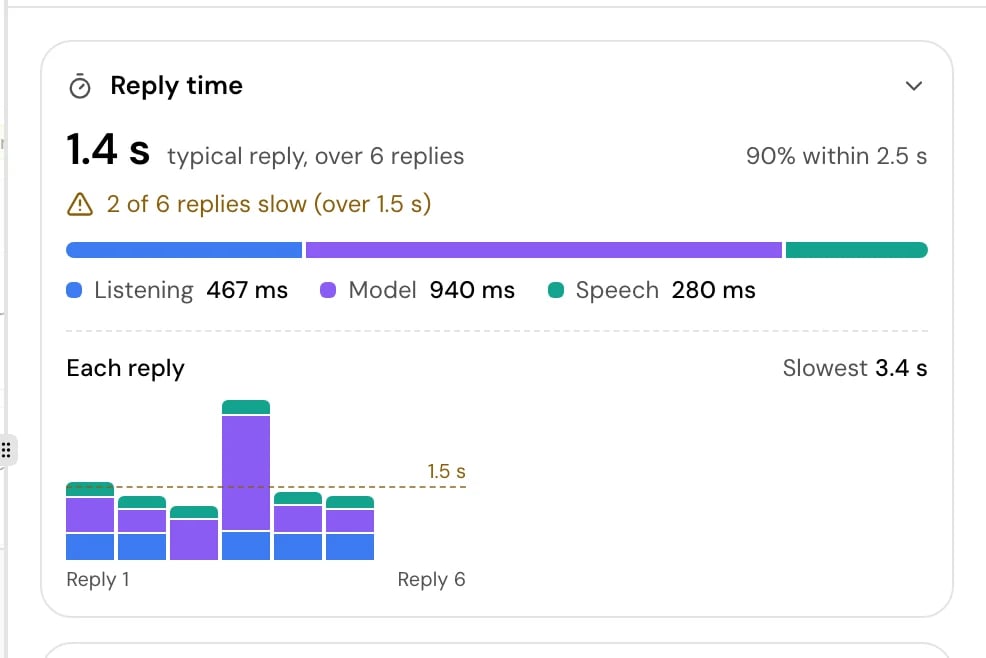
2
Go to the slowest reply
Click Slowest, or click a bar in Each reply. The transcript and the recording go to that reply.
3
See where the time went
The bar under the reply splits it into stages. A long Model, first token points at the model or a long prompt; check Token usage for the turn’s input. A long Settle wait or Turn timeout means the agent waited to be sure the caller had finished.
Follow a live call
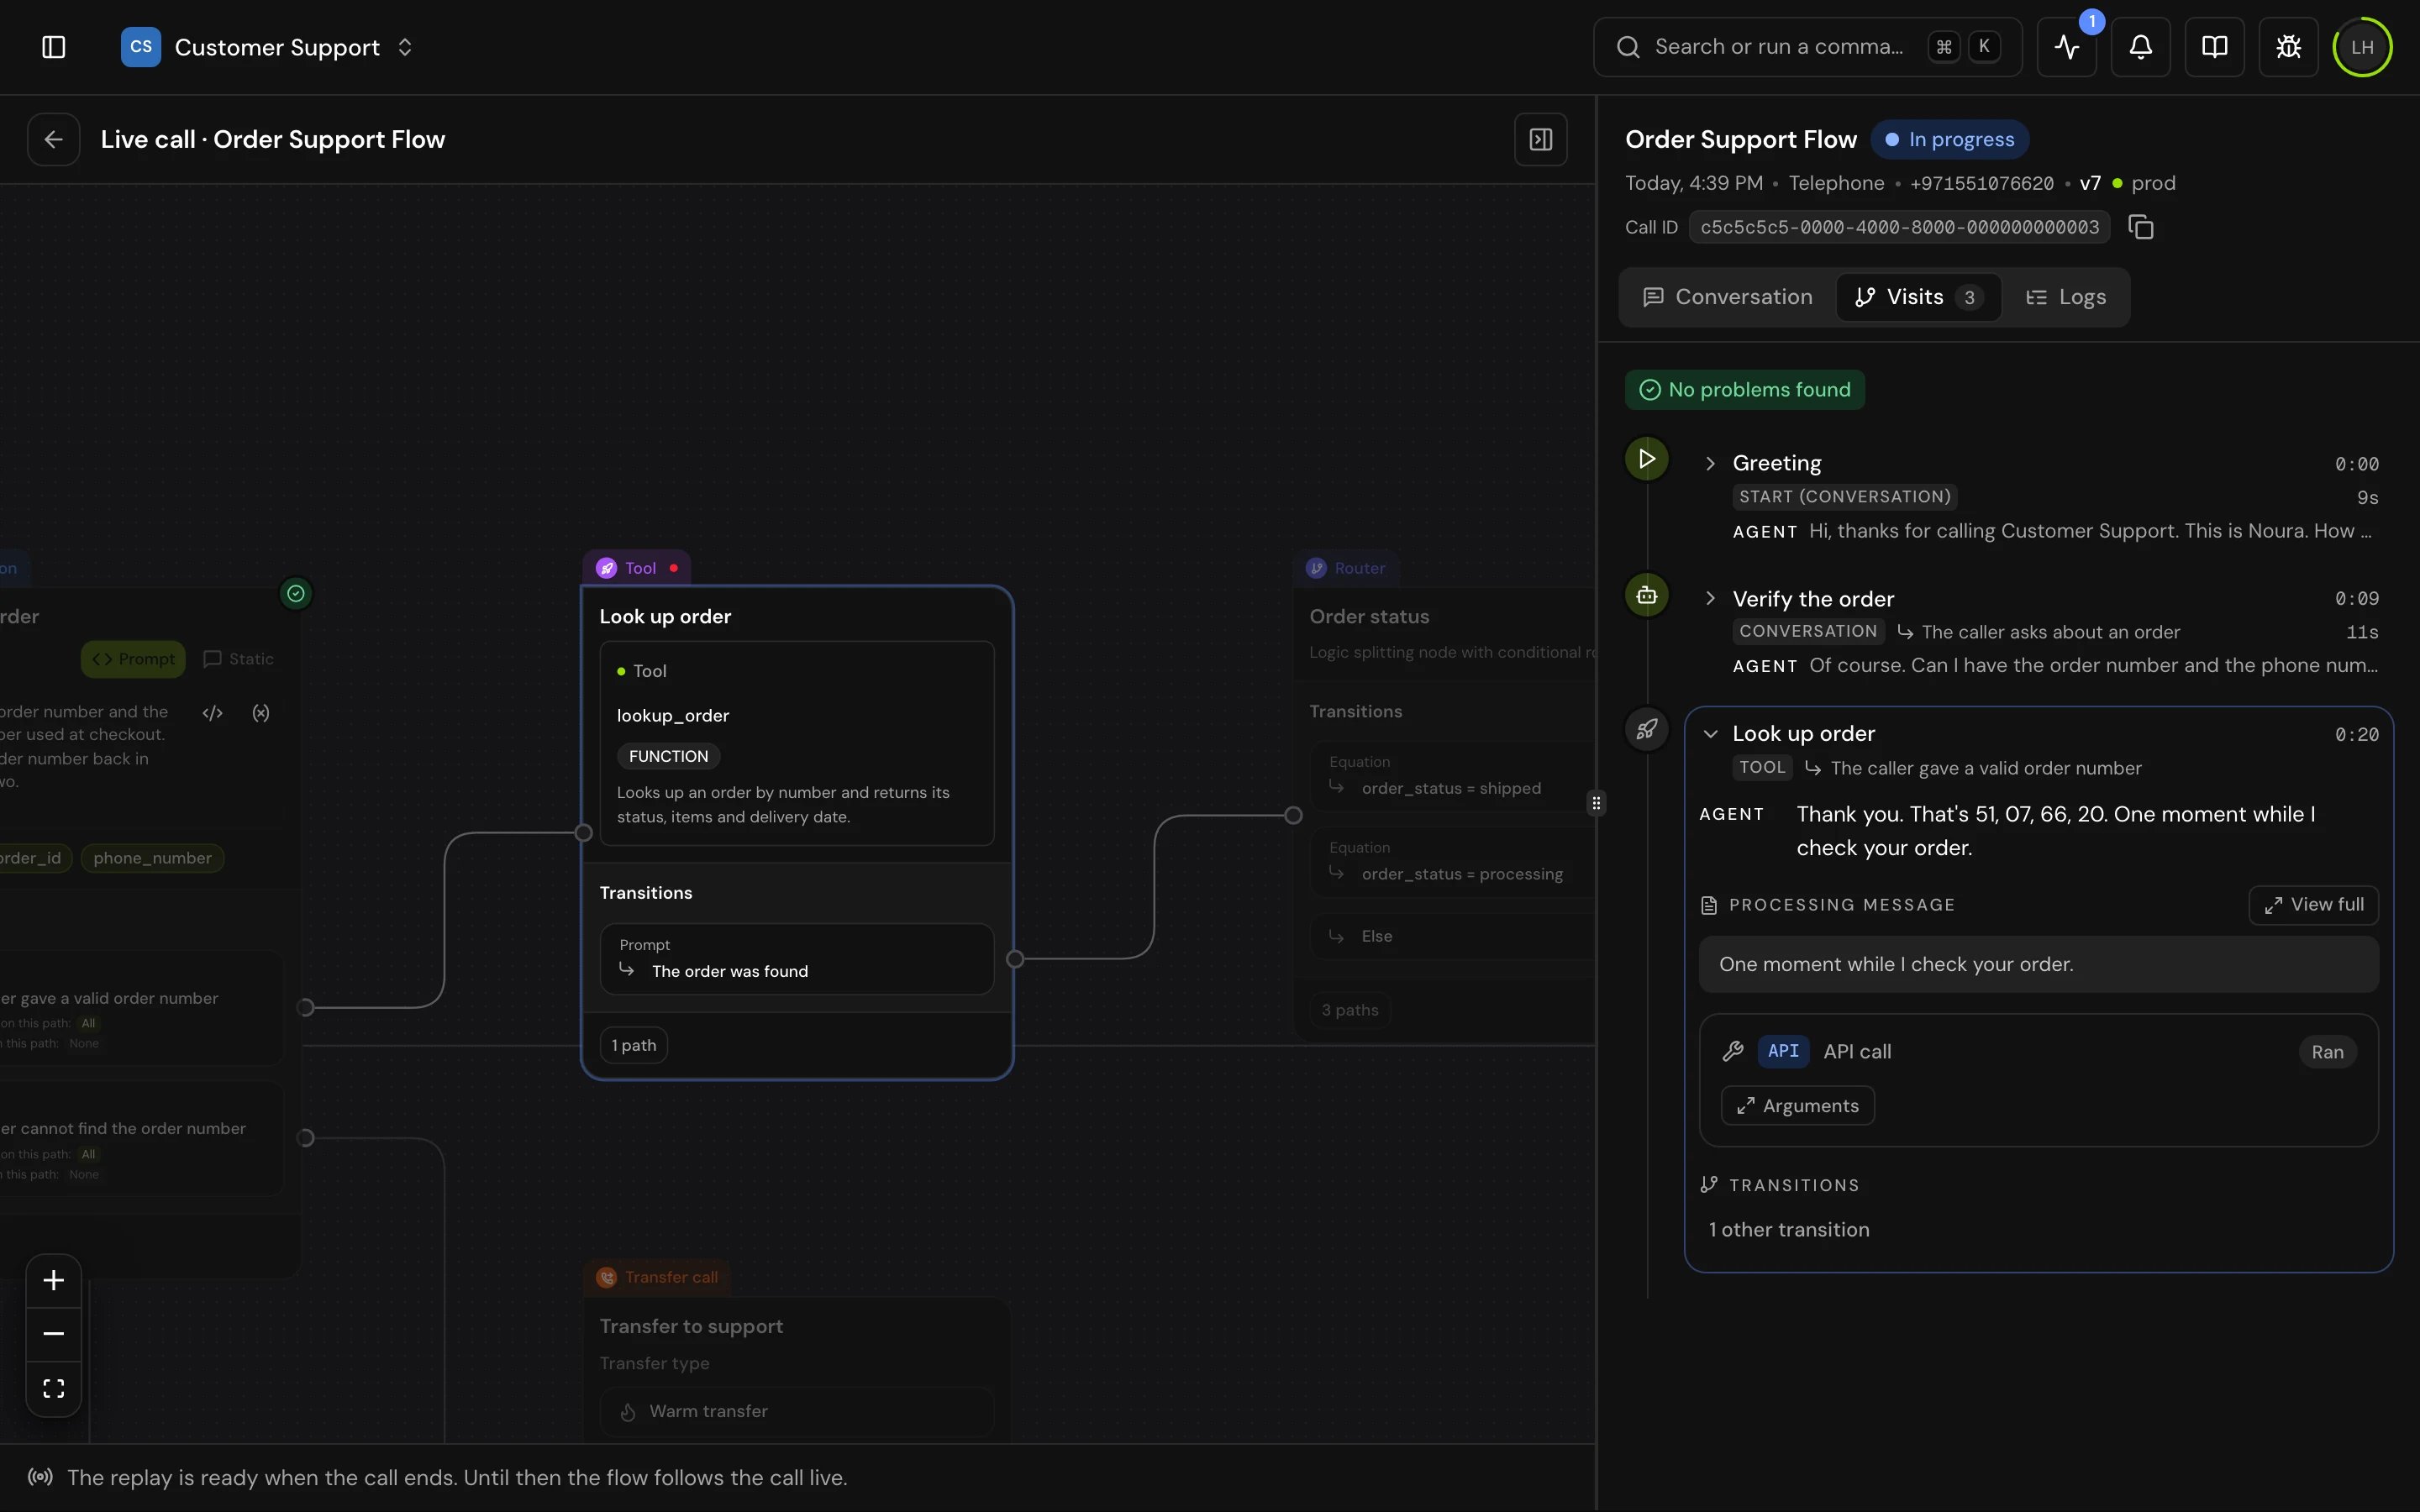
Open a call that’s still in progress and click Debug mode (its tooltip says “Follow this call on its flow, step by step, as it happens.”). The heading reads “Live call” and the agent’s name, and the footer says “The replay is ready when the call ends. Until then the flow follows the call live.”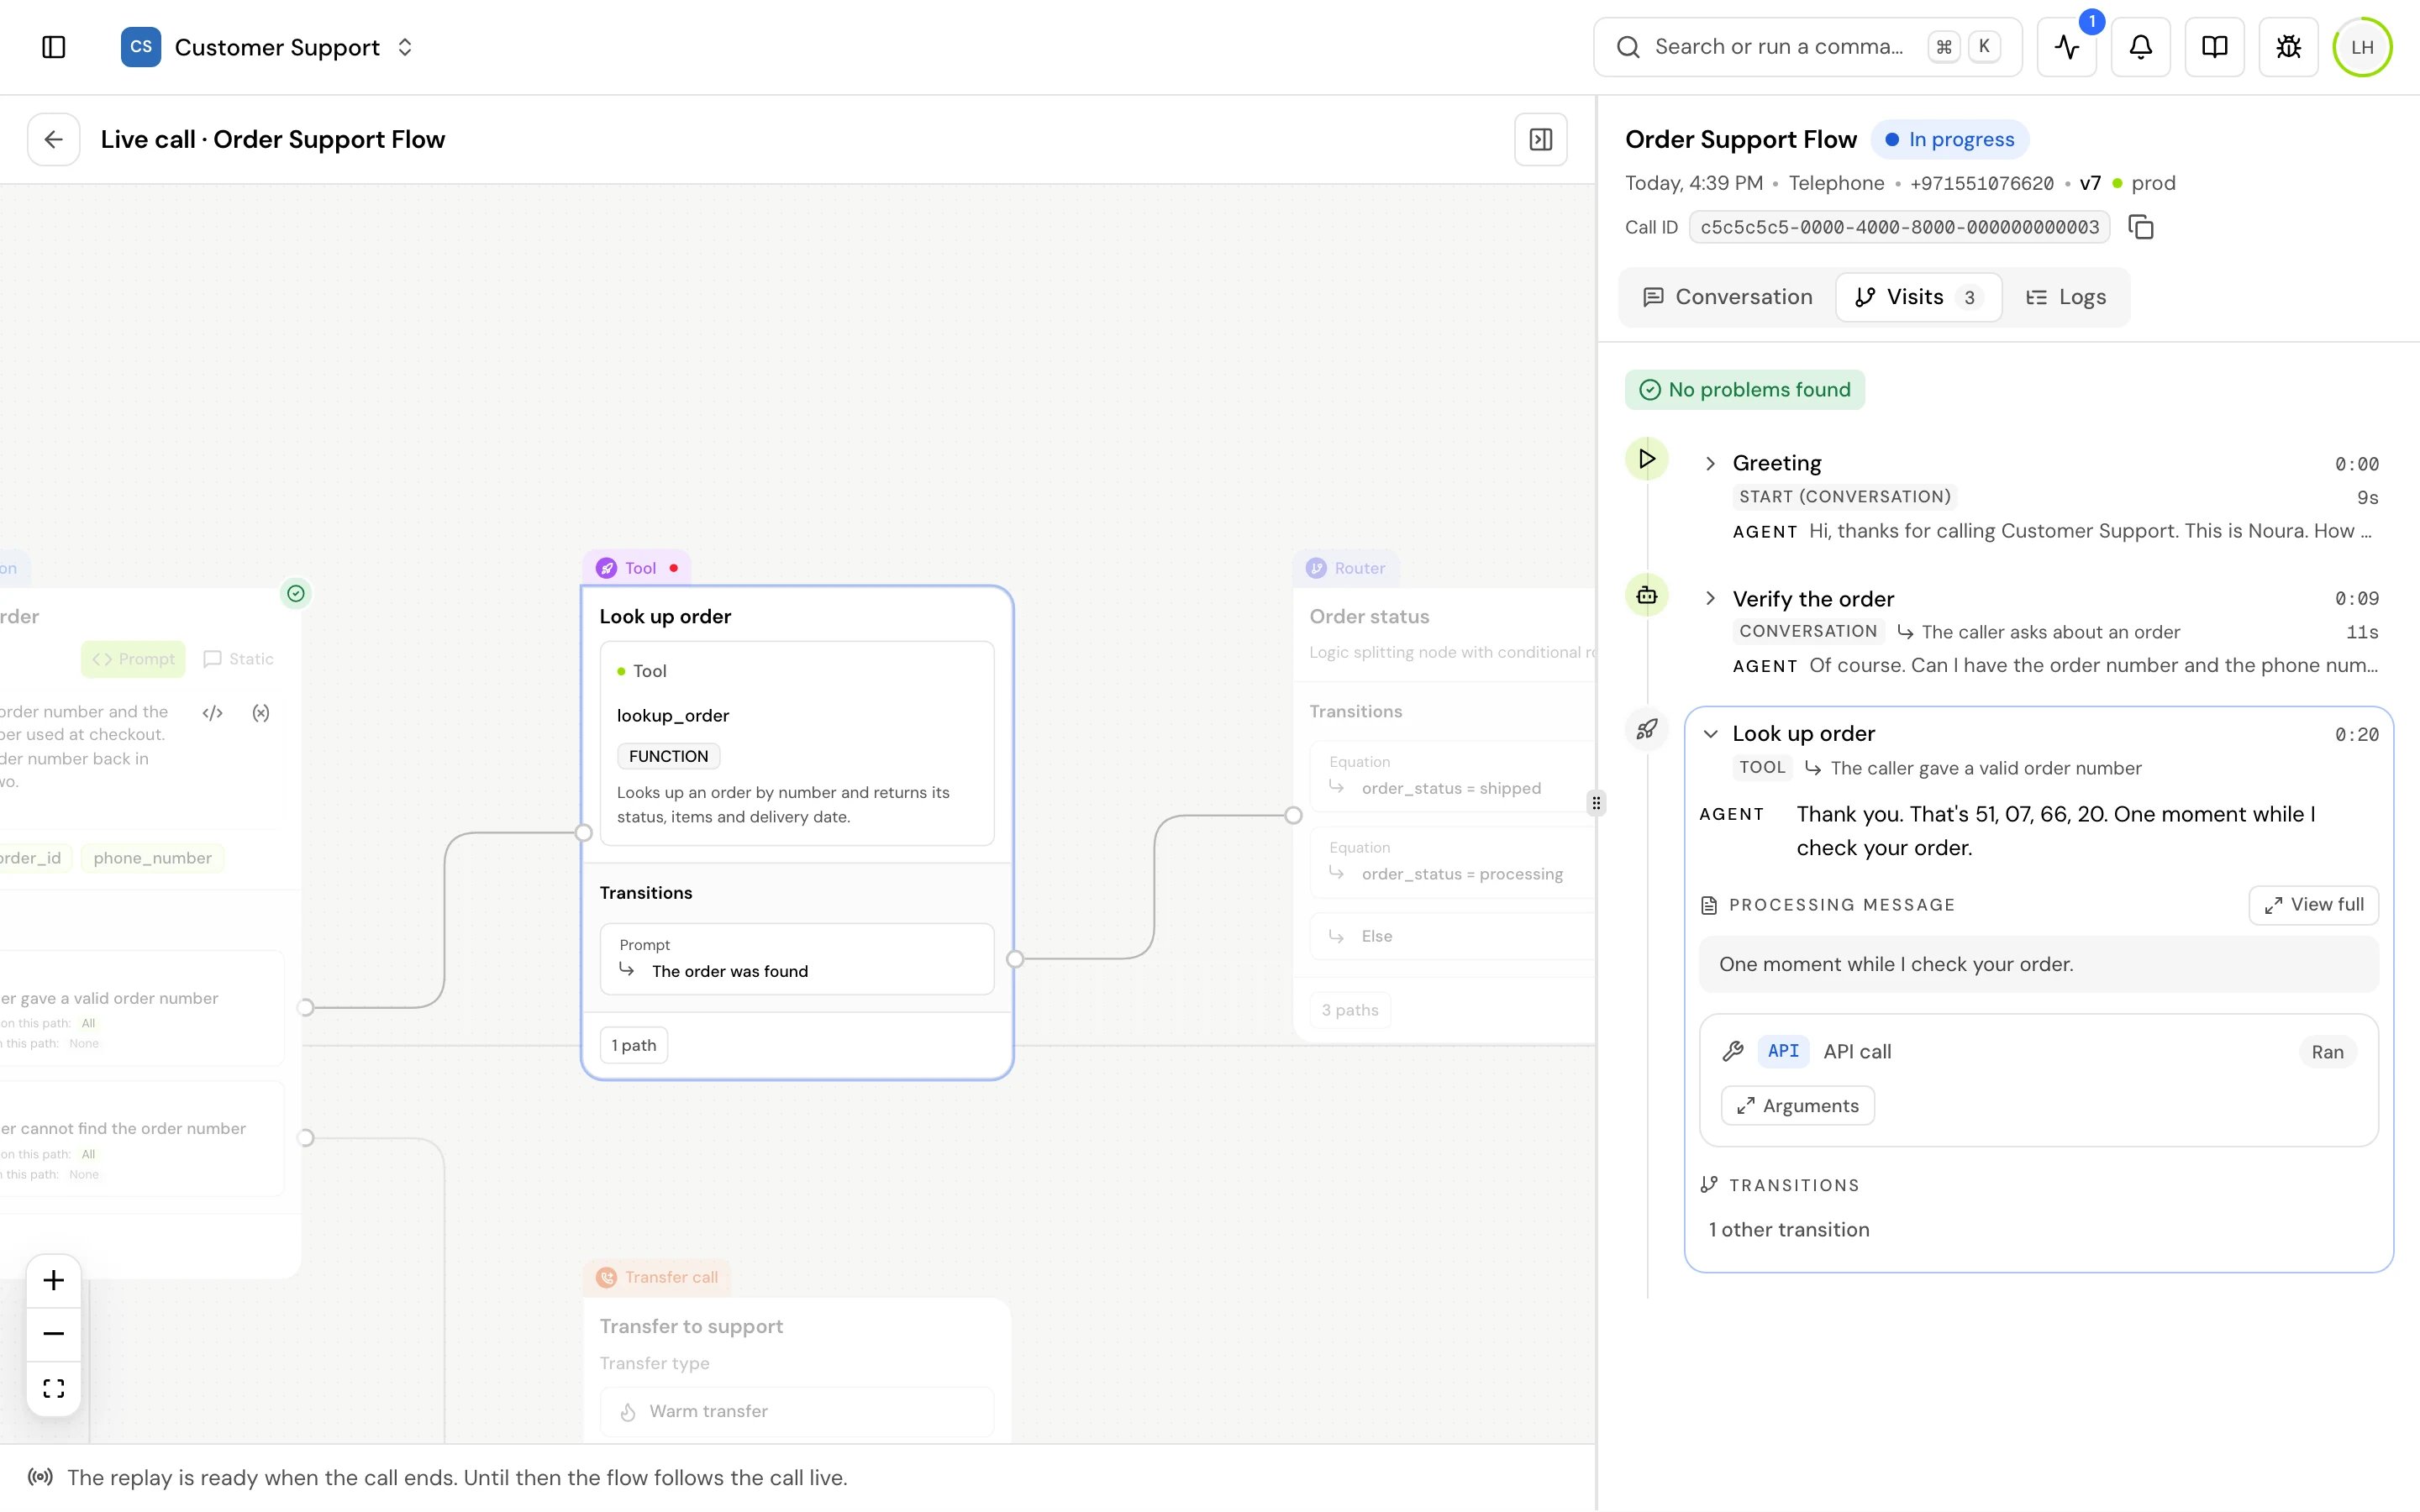
- Debug mode joins the call as a listener, so you hear it. A speaker button at the top right mutes and unmutes it. The caller doesn’t hear you. To speak or send instructions, use Live calls.
- The canvas moves to each step as the call reaches it. Click a step to filter the Logs to it.
- The Visits tab adds a card as the call moves through the flow, with the variables each step sets.
- The Conversation tab adds lines as they’re said. Search, the speaker filter, exports, Reply time and Token usage come once the call ends.
- The Logs tab adds events as they happen and stays at the newest. Scroll up to read, then click Jump to latest to follow again.
Reference
Problems
Debug mode checks each visit and reports what it finds. Errors are red, warnings amber, notes grey.
A required variable only counts when the flow reads it somewhere, and the transition that fired can switch it off for its path. The last visit of the call isn’t checked for extraction, because the call never left it.
How reply time is measured
Reply time is measured on voice calls, from the timings the call records for each agent reply. It runs from the caller finishing to the agent starting to speak. The greeting has no reply time.
The model can start while the agent is still waiting to be sure the turn ended. That overlap is counted once, so a reply’s time can be less than its stages added up.
In the Reply time panel, the typical reply is the median, “90% within” is the time nine replies in ten beat, and a reply is slow when it takes over 1.5 seconds. Listening, Model and Speech show the average of each part. Drag across Each reply to zoom in on some replies; Escape or Show all zooms back out.
How token usage is counted
Token usage adds up the tokens the agent’s model reported for each reply on the call. It doesn’t include any other model, and it shows tokens only, not cost.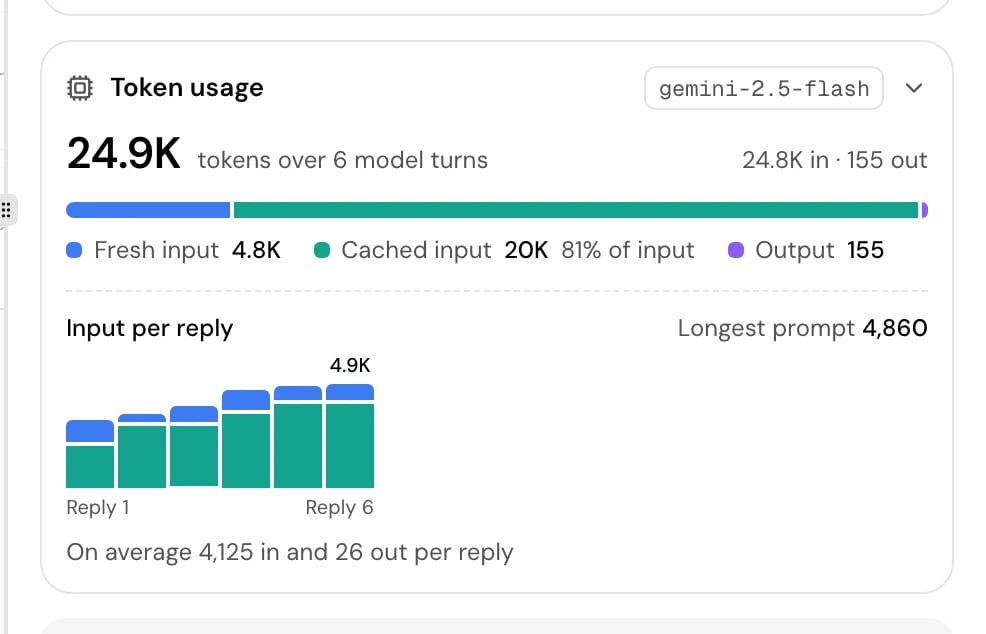
Keyboard shortcuts
These work anywhere in debug mode while a recording is loaded, except while you type in a field or have a menu open. Press? to see every shortcut.
With debug mode open, the command menu (Cmd+K on Mac, Ctrl+K on Windows) also has “Play or pause the recording” and the playback speeds.
Good to know
- A link with
?t=at the end opens the call at that moment: seconds (?t=95), or minutes and seconds (?t=1:35). As the recording plays, the address bar keeps the current moment, so the link you copy from it lands there too. - If a call’s logs don’t show it moving between steps, debug mode shows the flow with “The logs of this call do not show it moving through the flow.” and the Visits tab says No visits logged.
- When some lines of the transcript can’t be placed on a step, the end of the Visits tab says how many.
- Personal details a guardrail encoded on the call show as Hidden until you enter the key. See Protect personal data.
- Changing the flow after a call doesn’t change its replay: debug mode shows the flow as the call ran it, unless the label says Today’s flow.
Related
Call details
The transcript, recording, analysis and logs of any call.
Transitions
How a flow moves from one step to the next.
Test your agent
Make test calls, then replay them here.
Policies and guardrails
What the guardrails and policies at each step are.