

The Outcome dashboard is in beta and switched on for selected projects.
Before you start
- Viewing needs View on Outcome dashboard (“See the outcome dashboard.”). Changing it needs Edit (“Change what the outcome dashboard tracks.”). Owners and Admins have both by default; Users have neither. See Roles and permissions.
- To chart your own fields, the agent needs outcome fields in its Outcome settings, and it must be published. Fields come from the published agent.
Open the dashboard
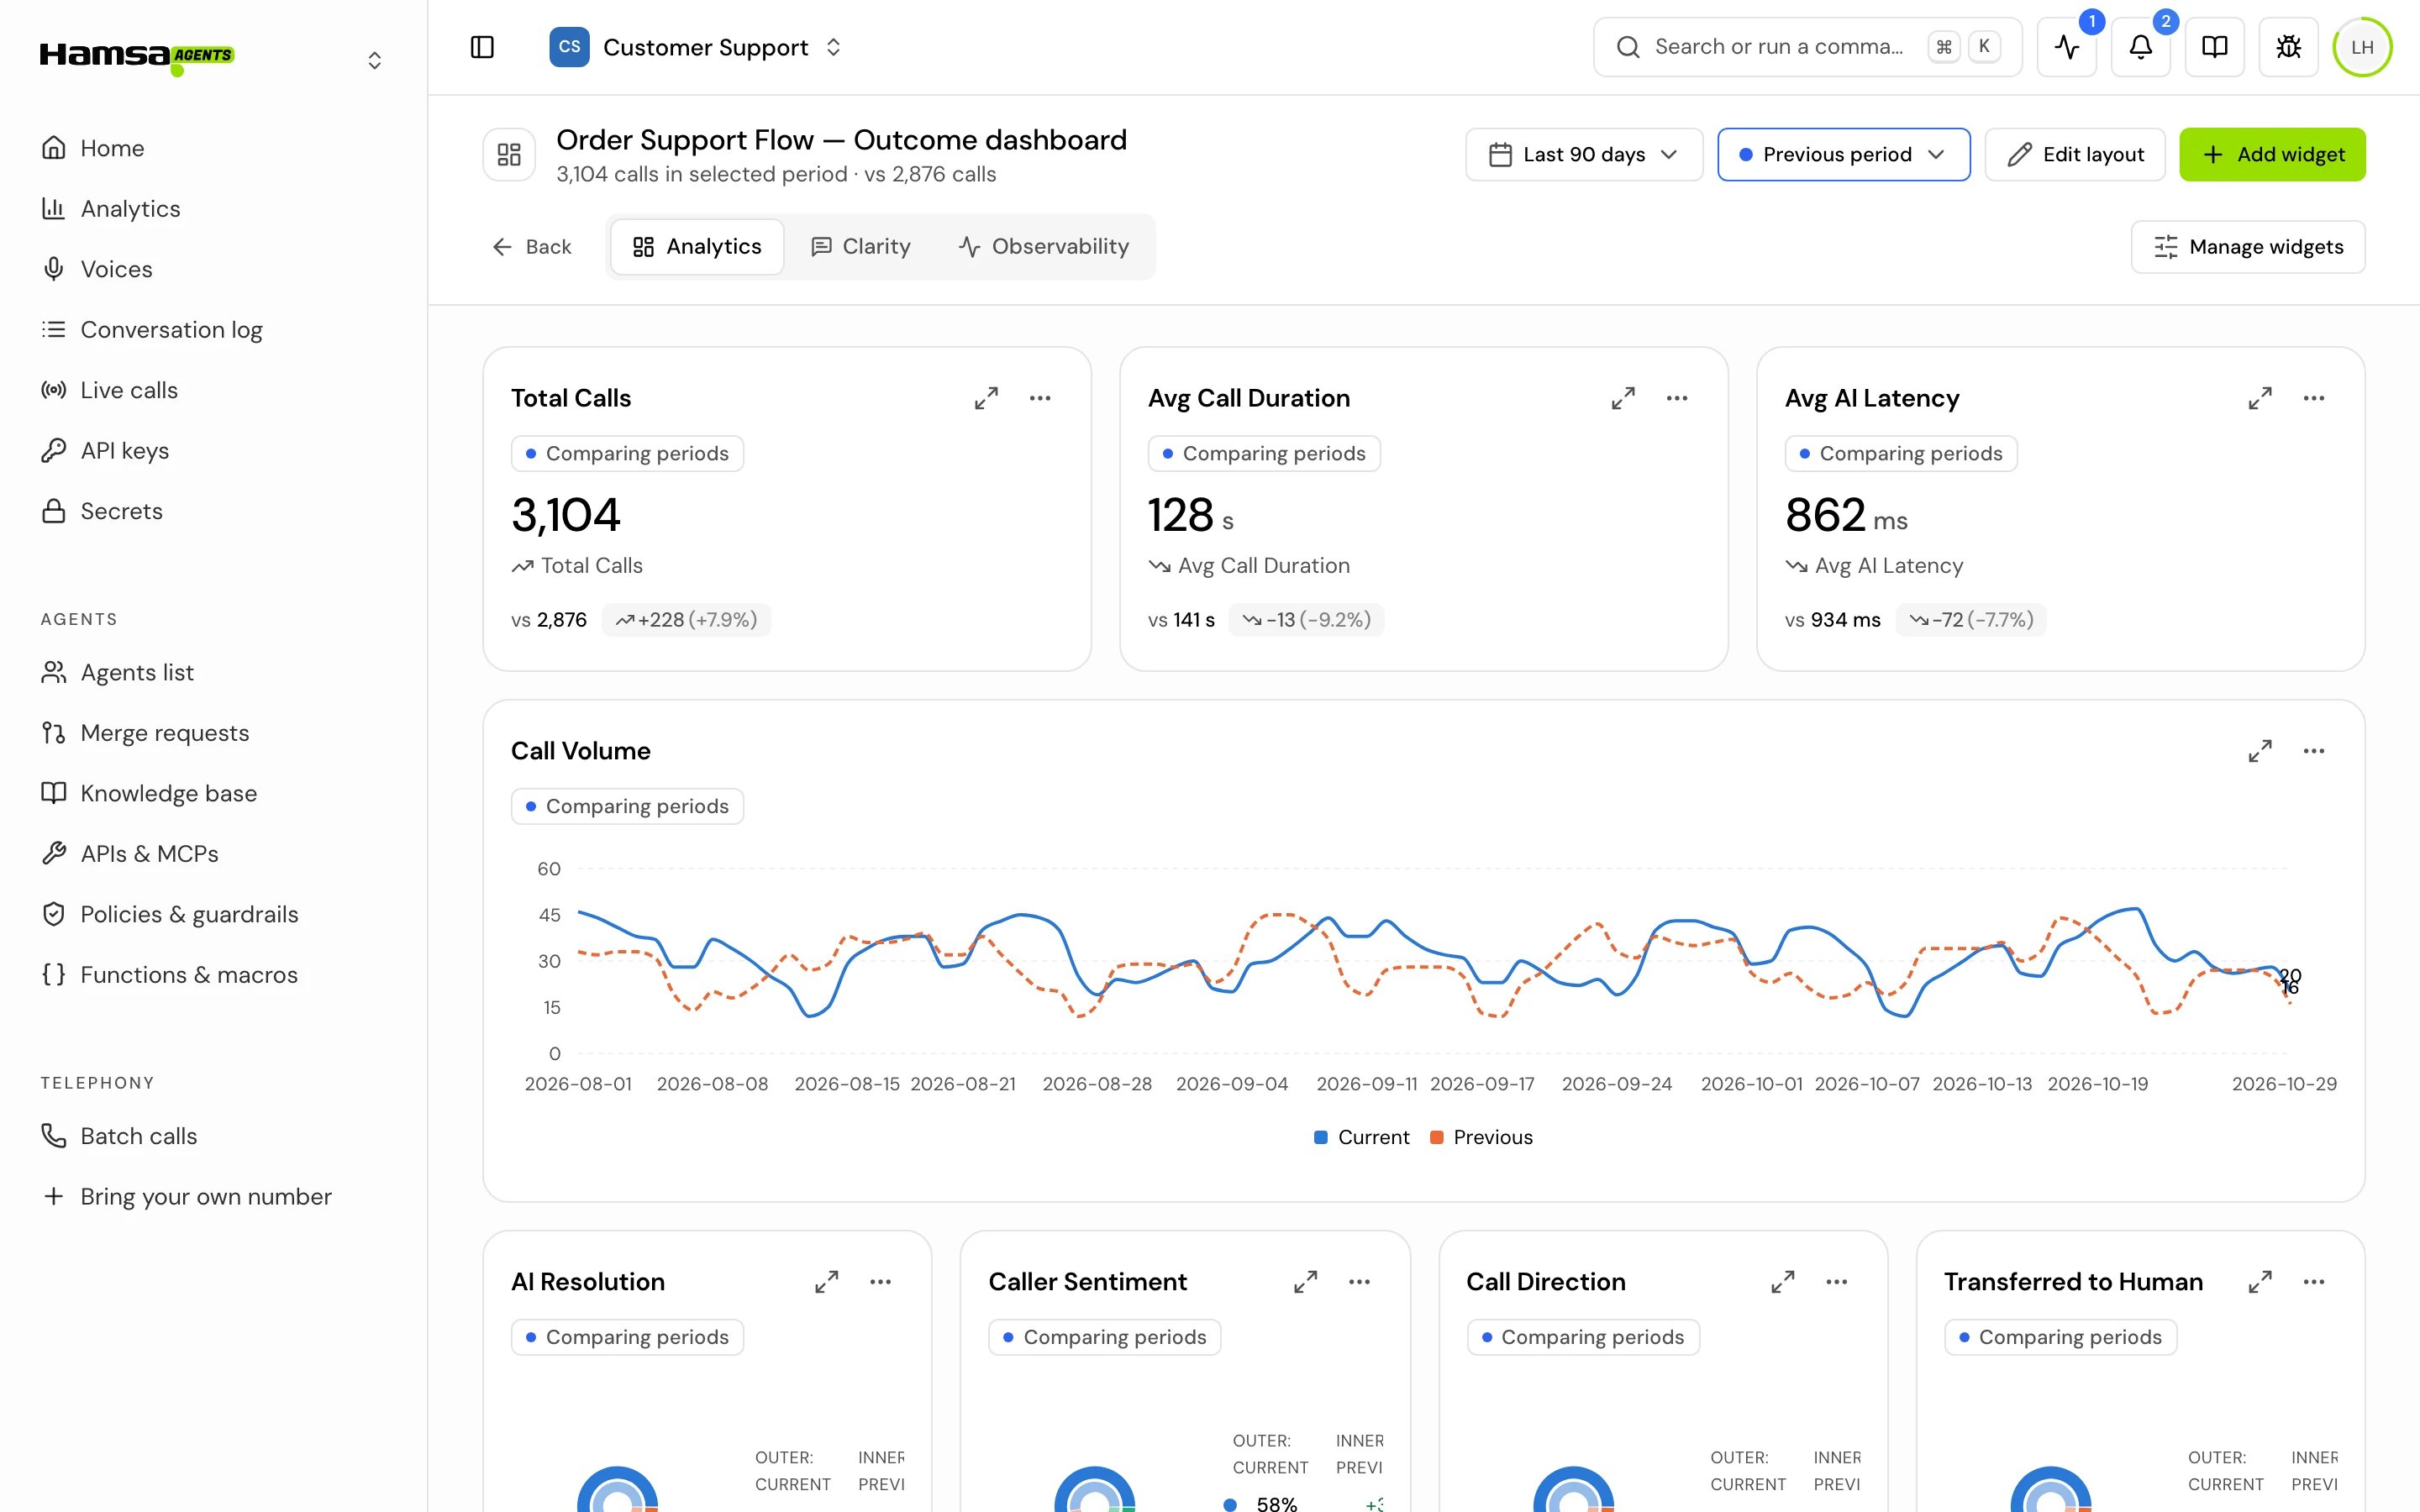
In the agents list, click the chart icon in the agent’s Outcome column (“How this agent’s calls went: resolved, transferred, sentiment and more.”), or open the agent’s row menu and choose Outcome dashboard. The header shows how many calls fall in the period, for example “1,240 calls in selected period”.Choose the period and compare
- Period: Last 7 days, Last 30 days, Last 90 days (the default), This week, This month or Custom range. A range can be up to 1000 days.
- Compare: No comparison, Previous period (the same number of days just before), Year ago (the same days a year earlier) or Custom range. Charts then show the earlier period beside the current one.
The three tabs
Analytics
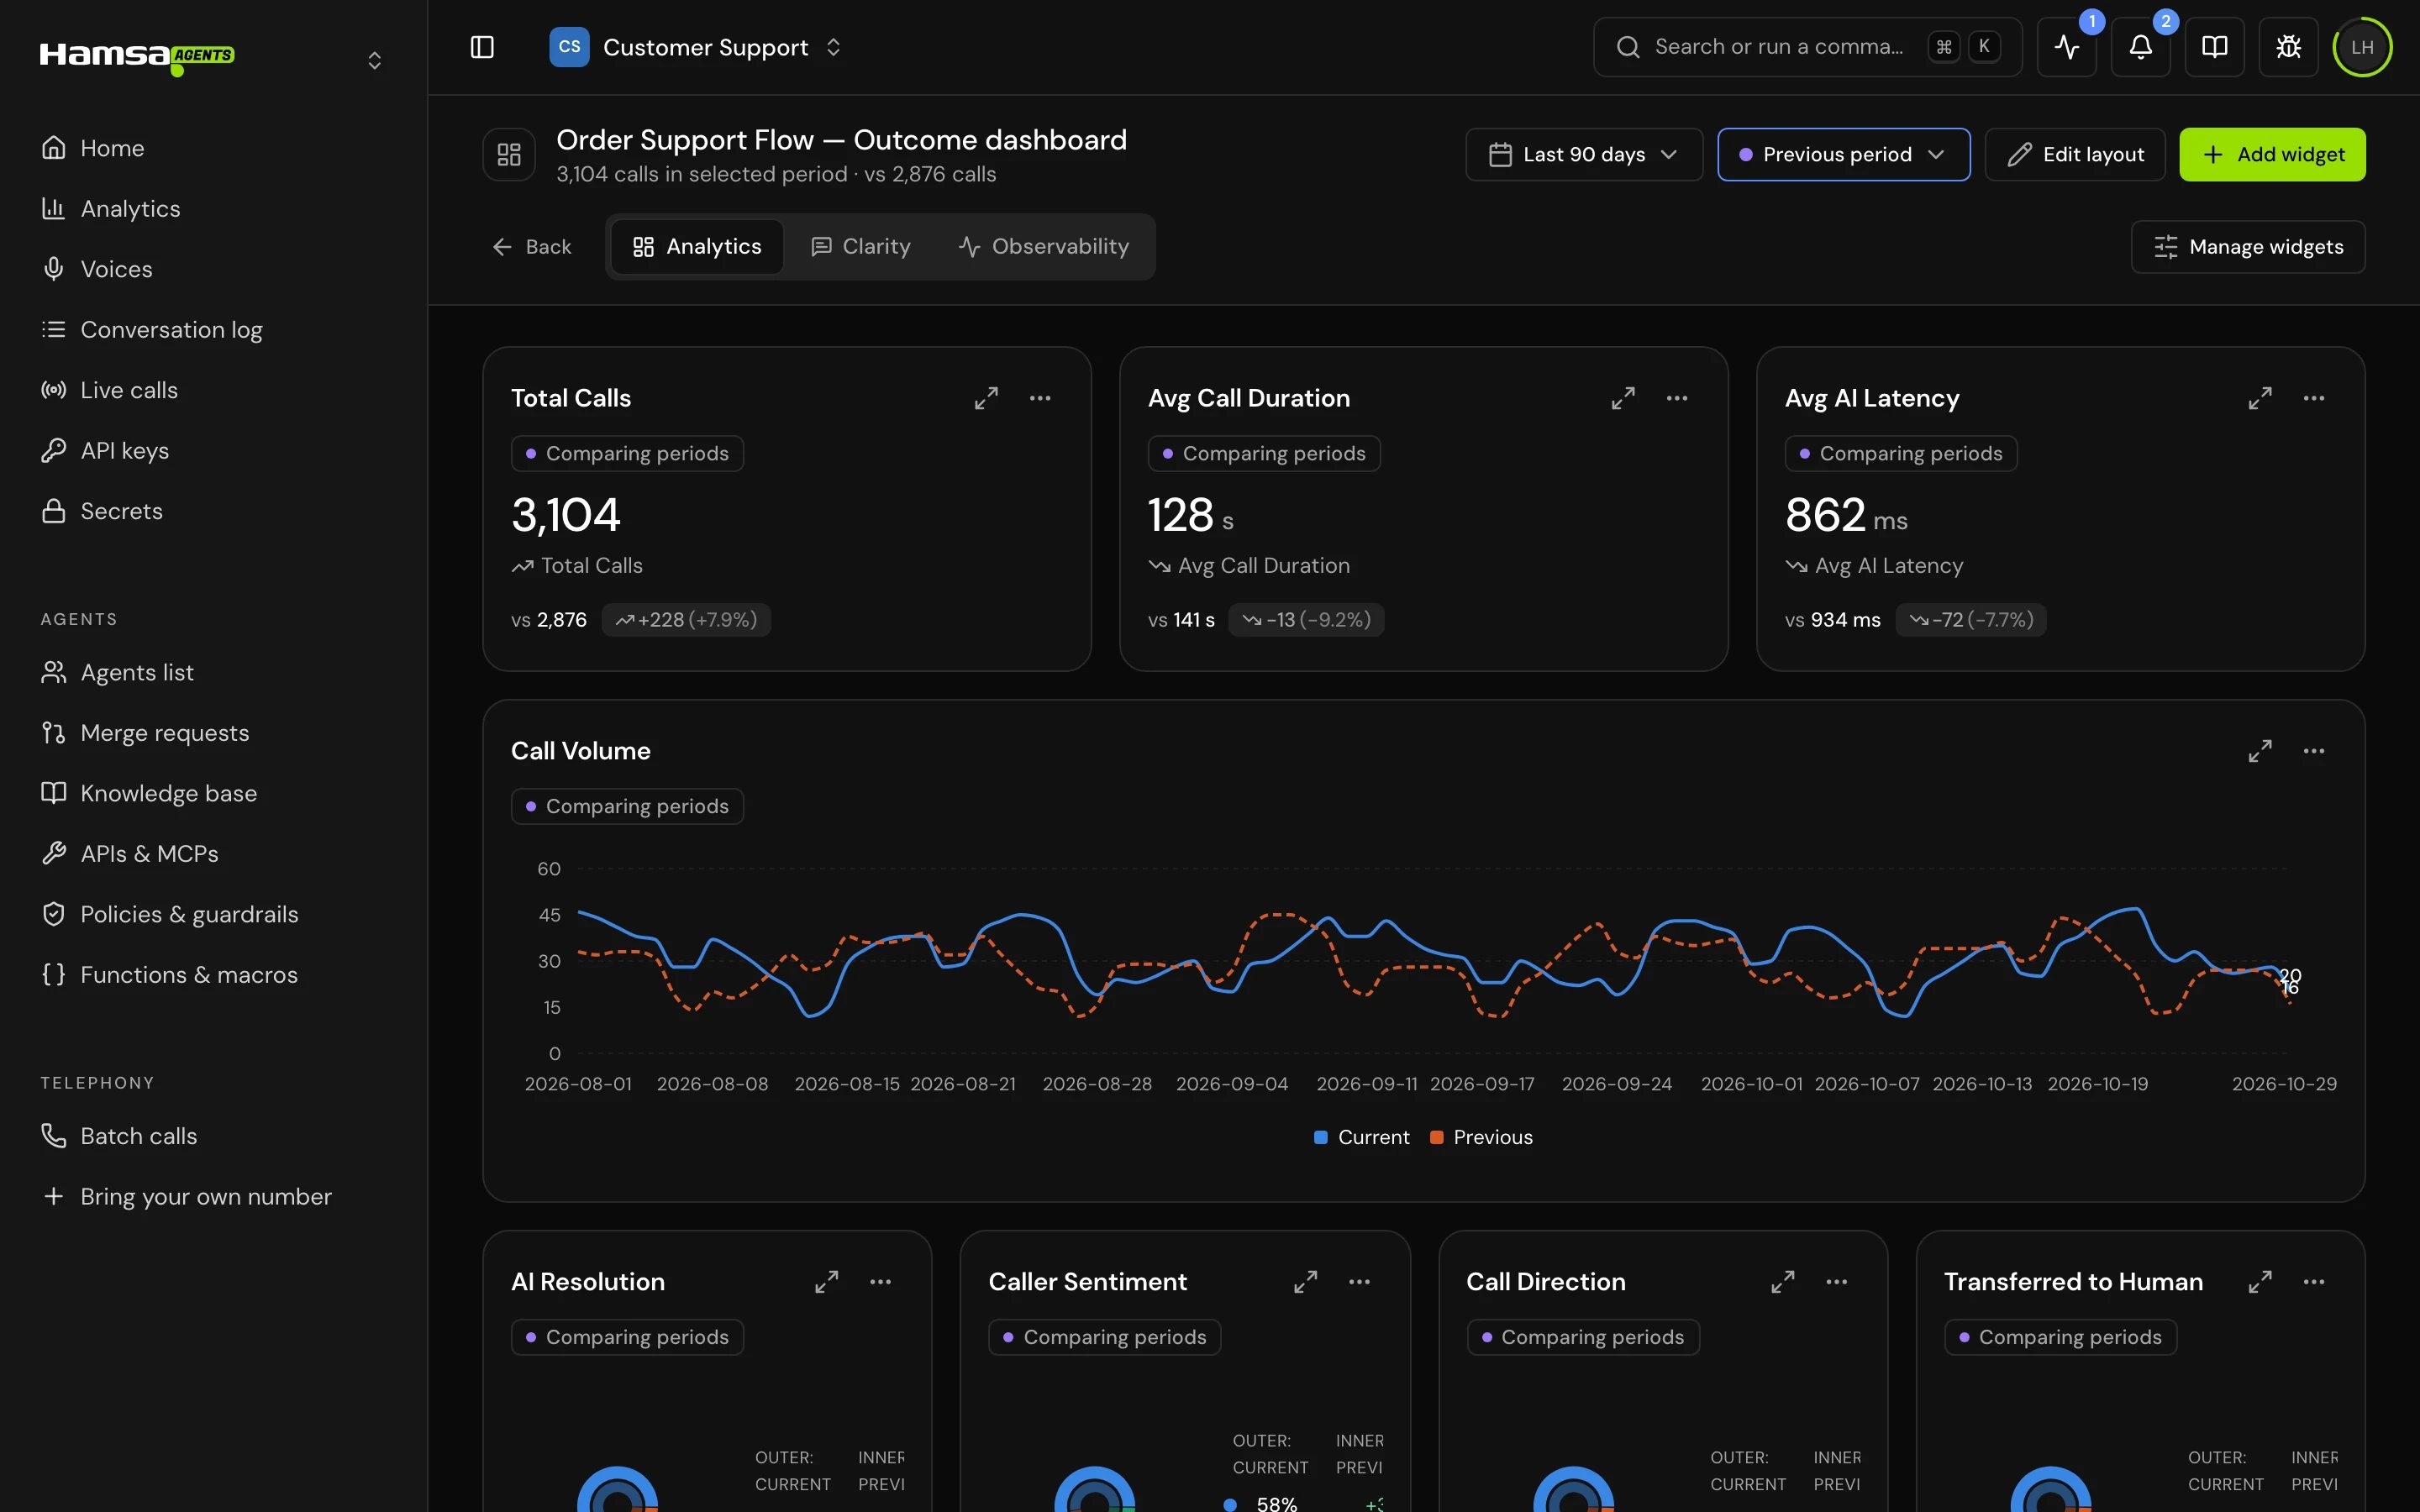
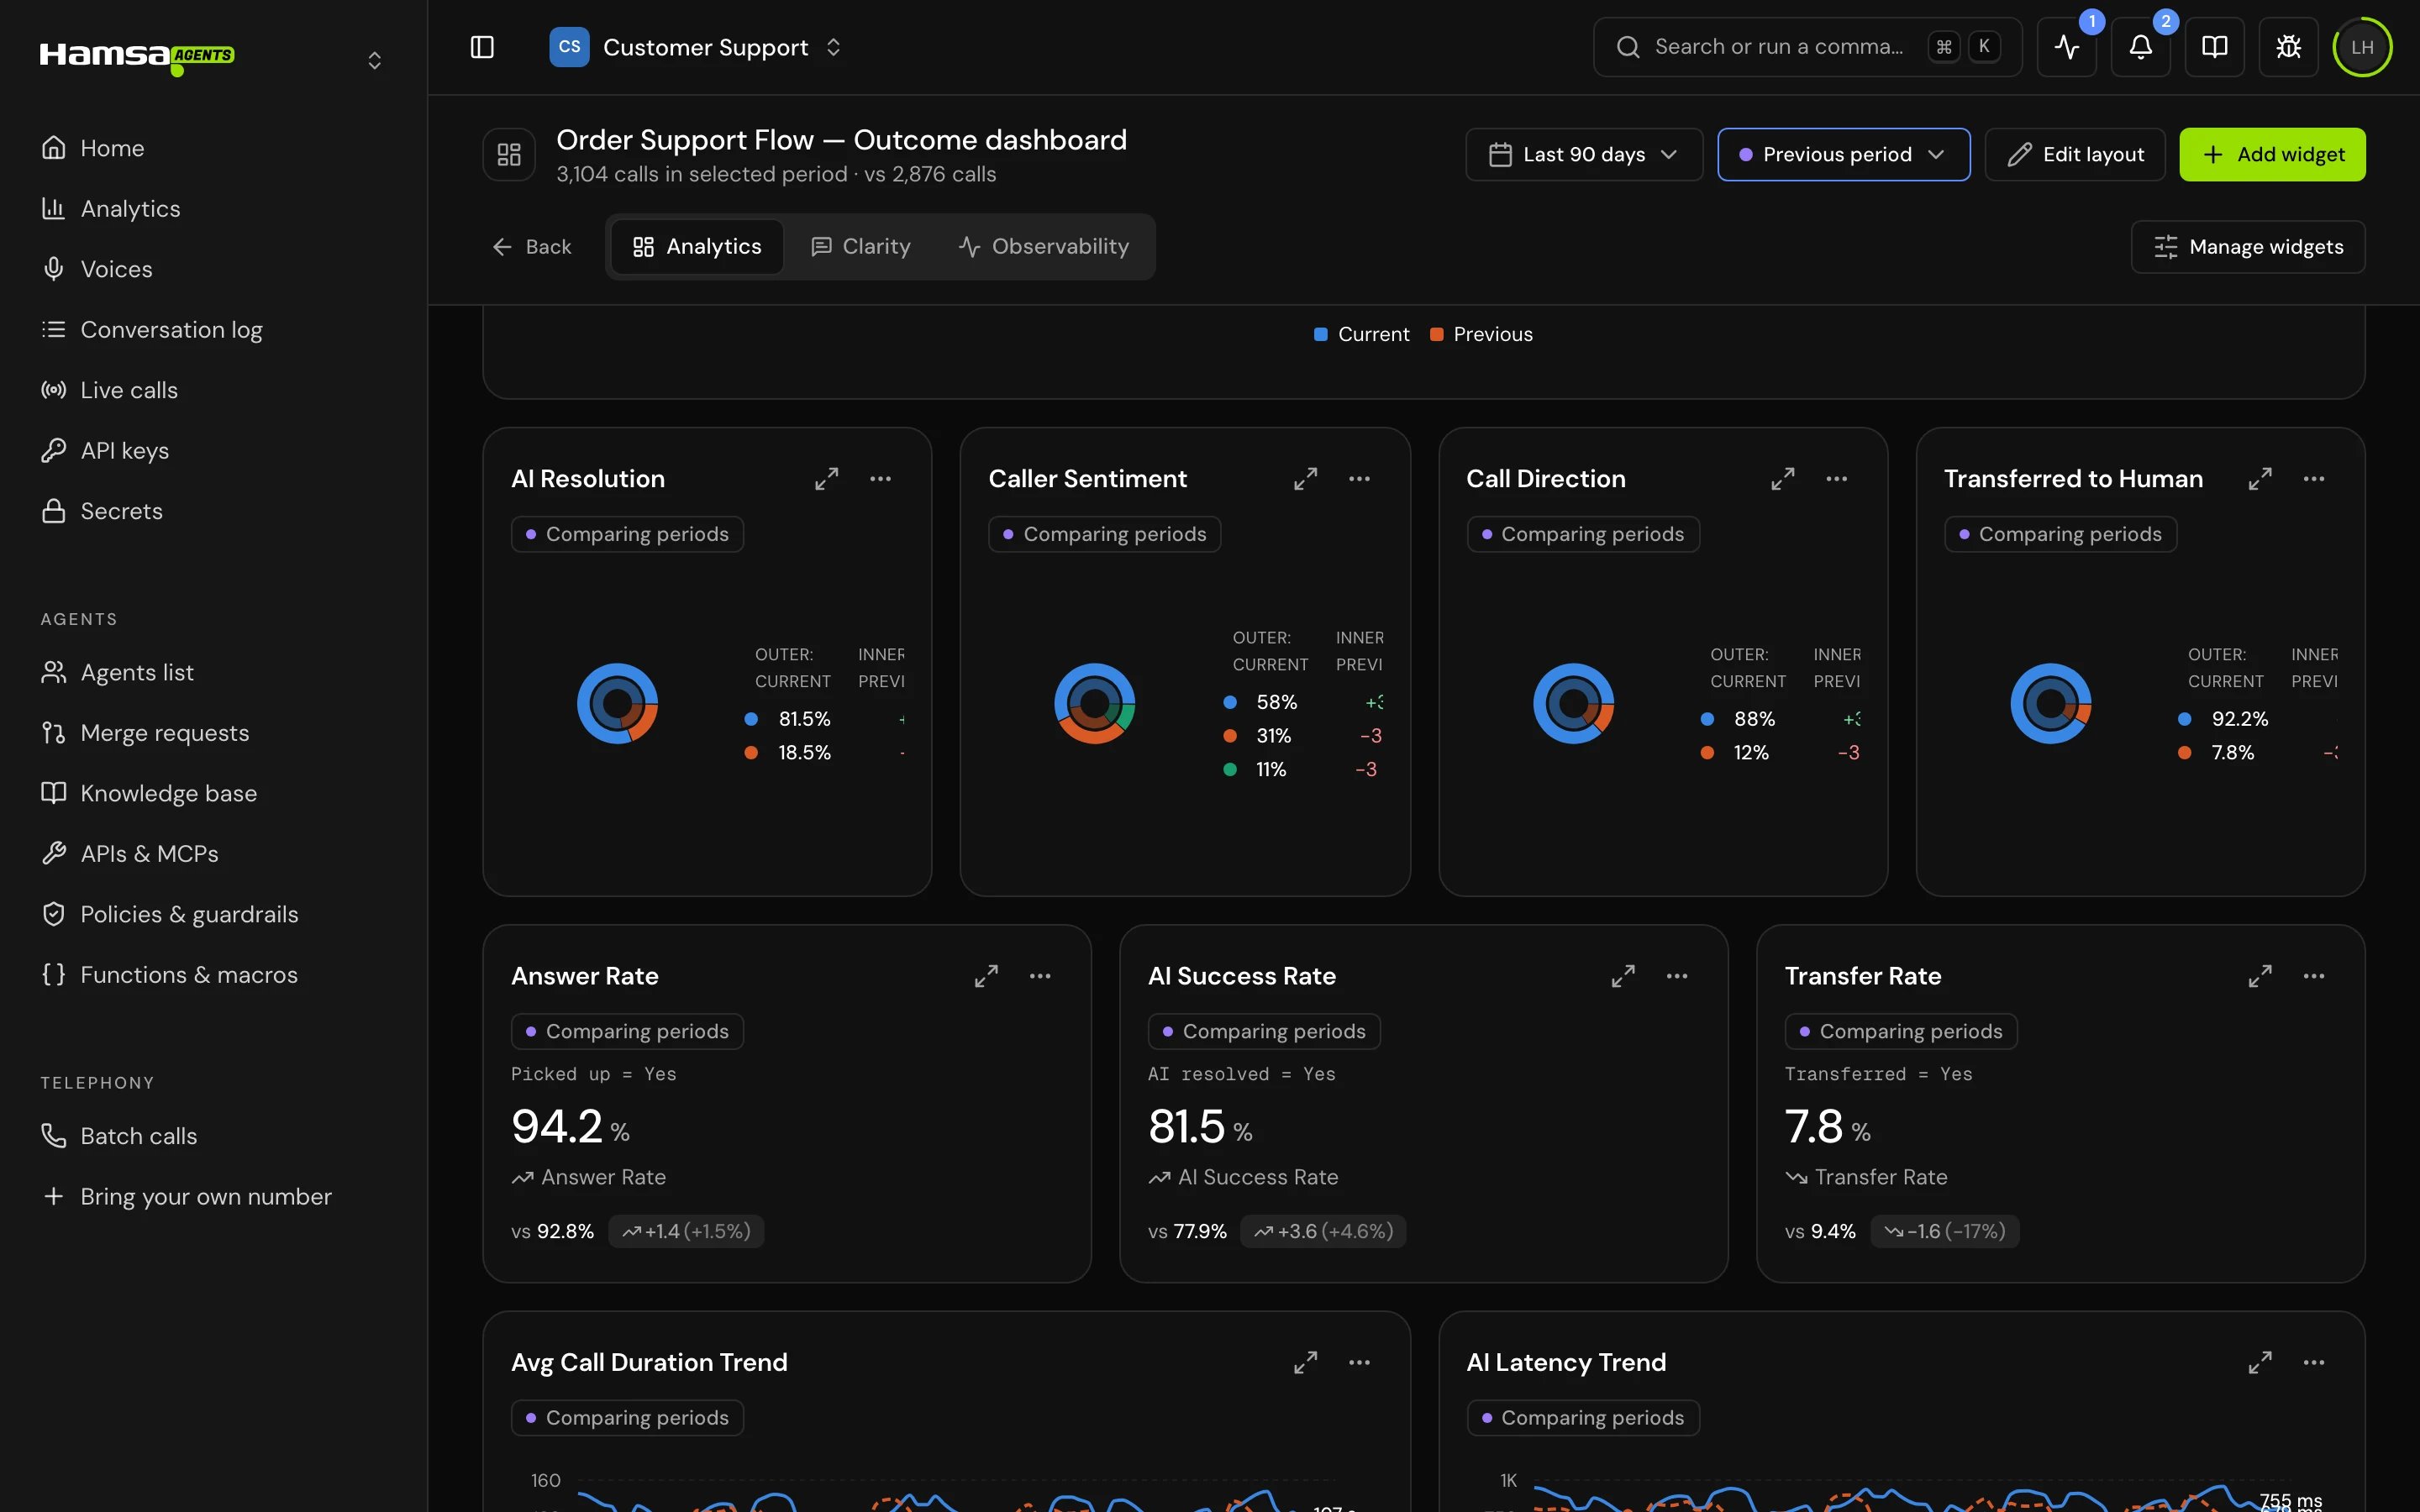
Charts of this agent’s calls. It starts with these widgets: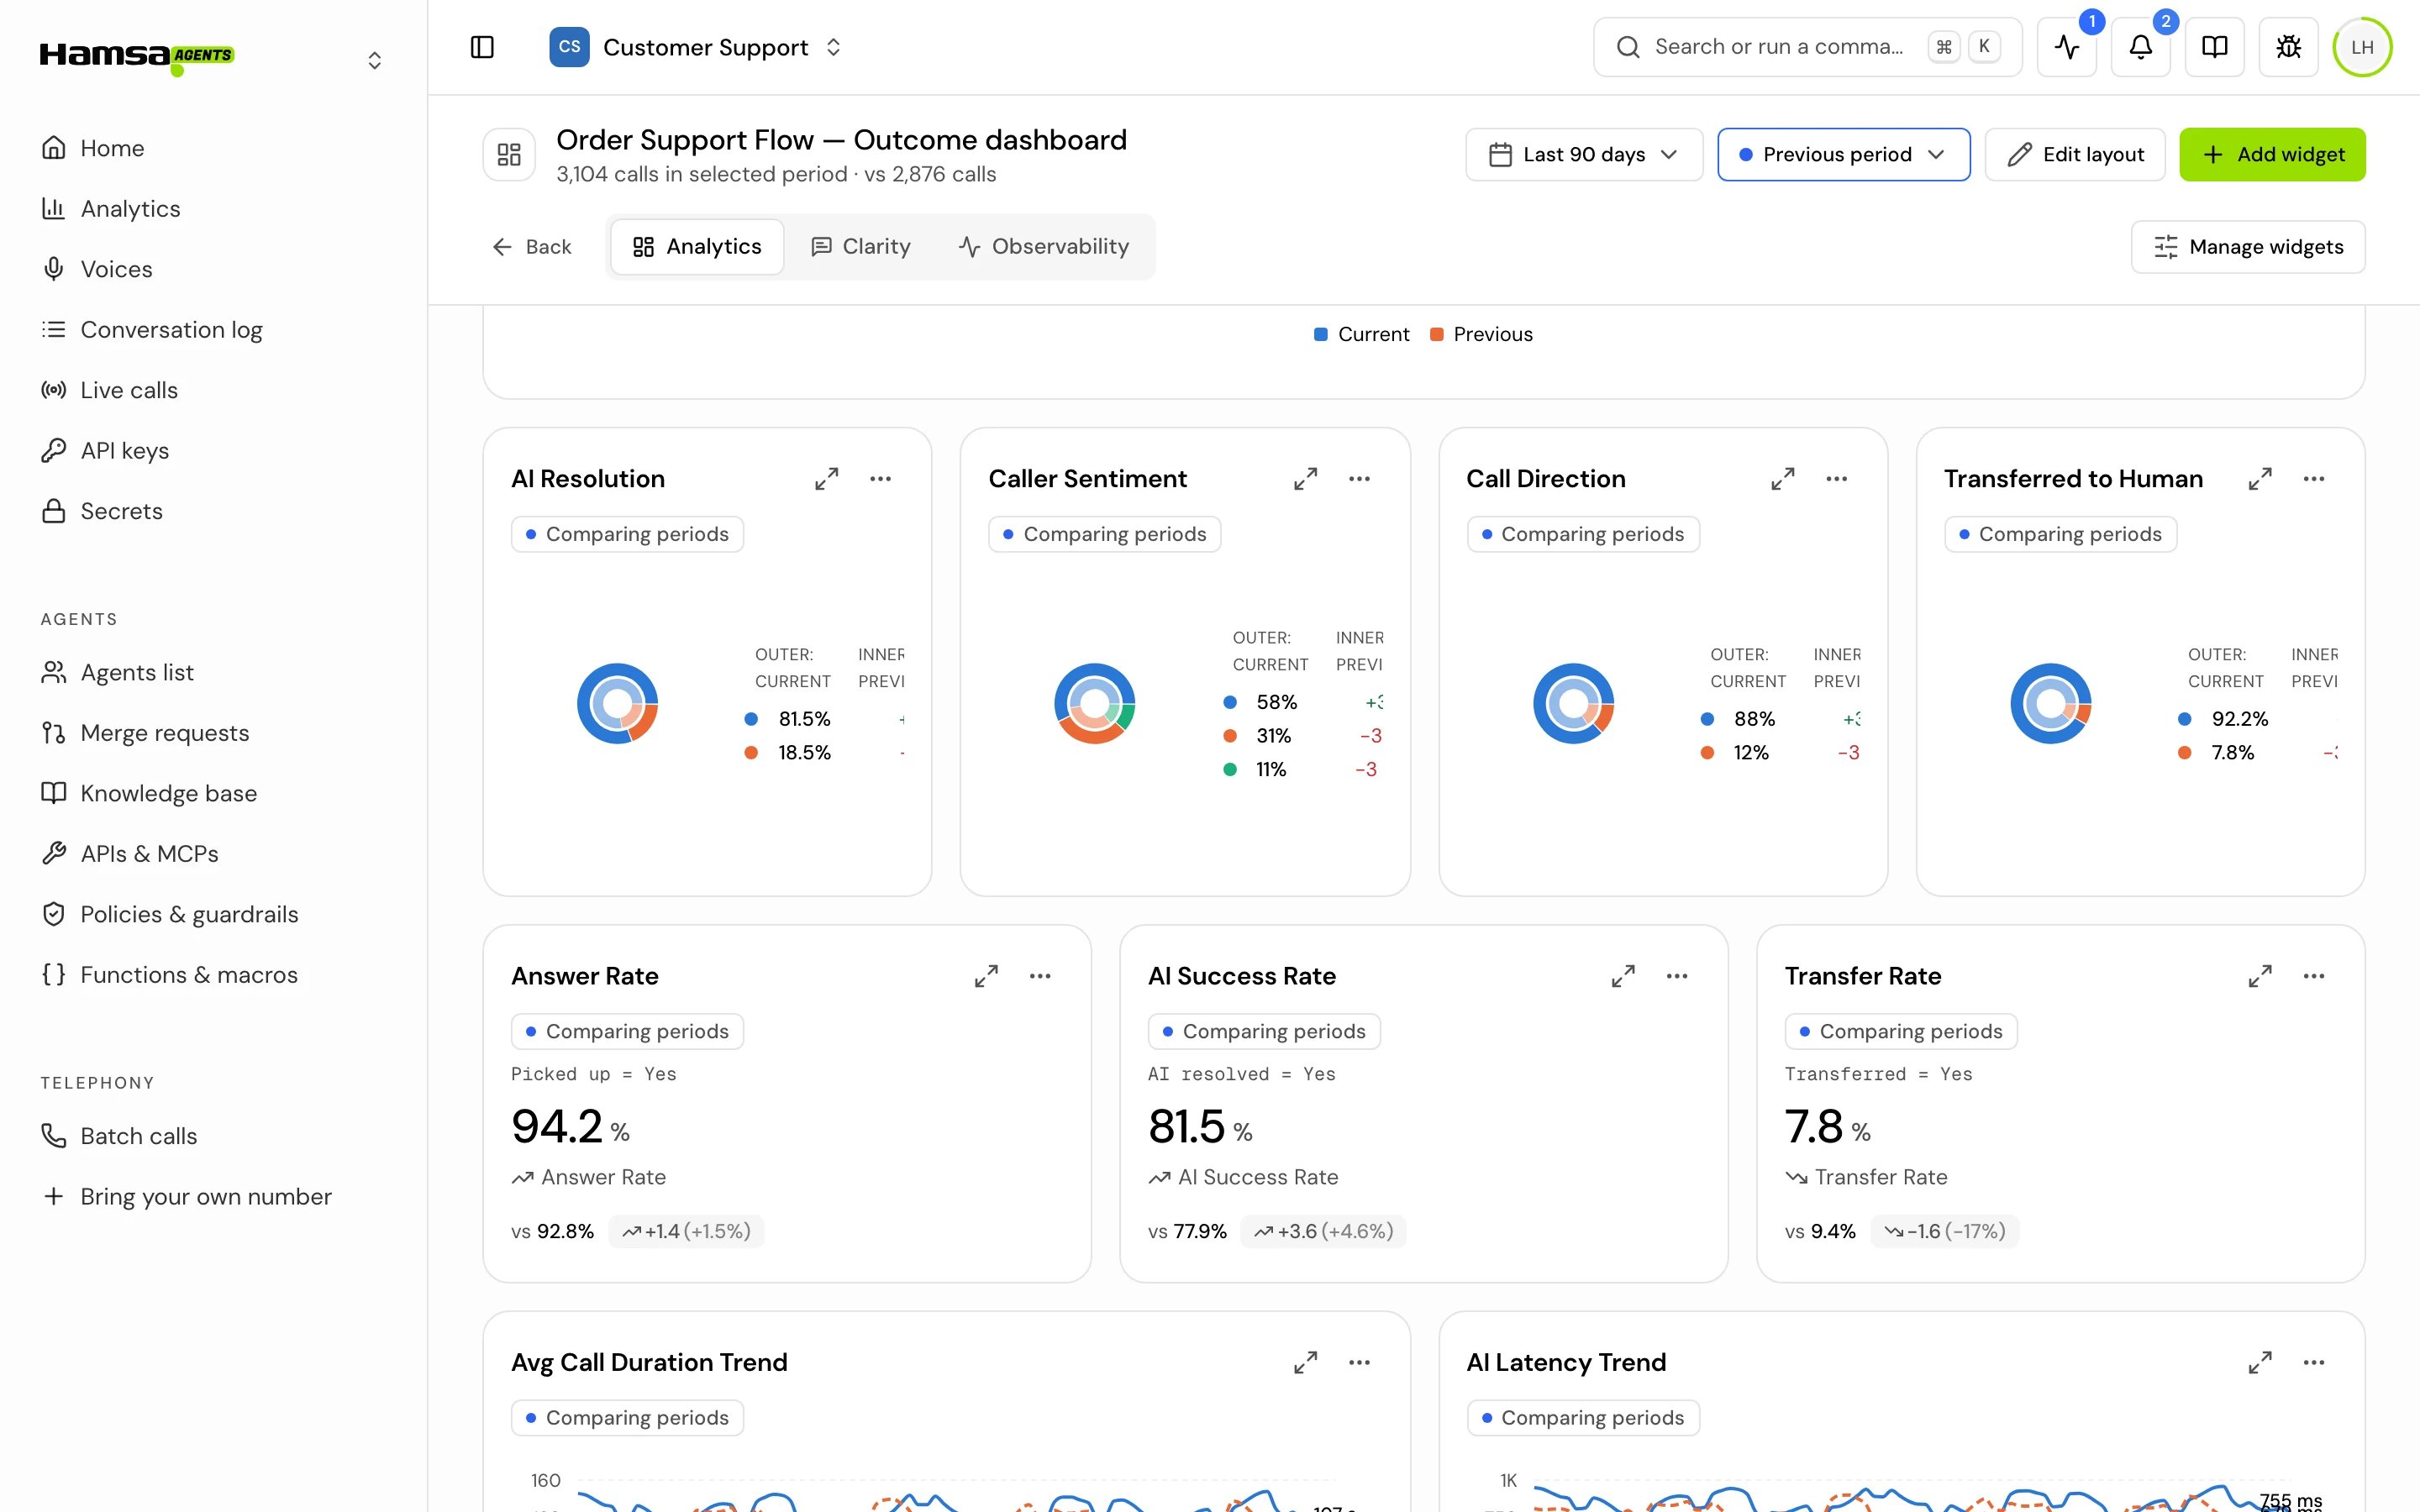
Clarity
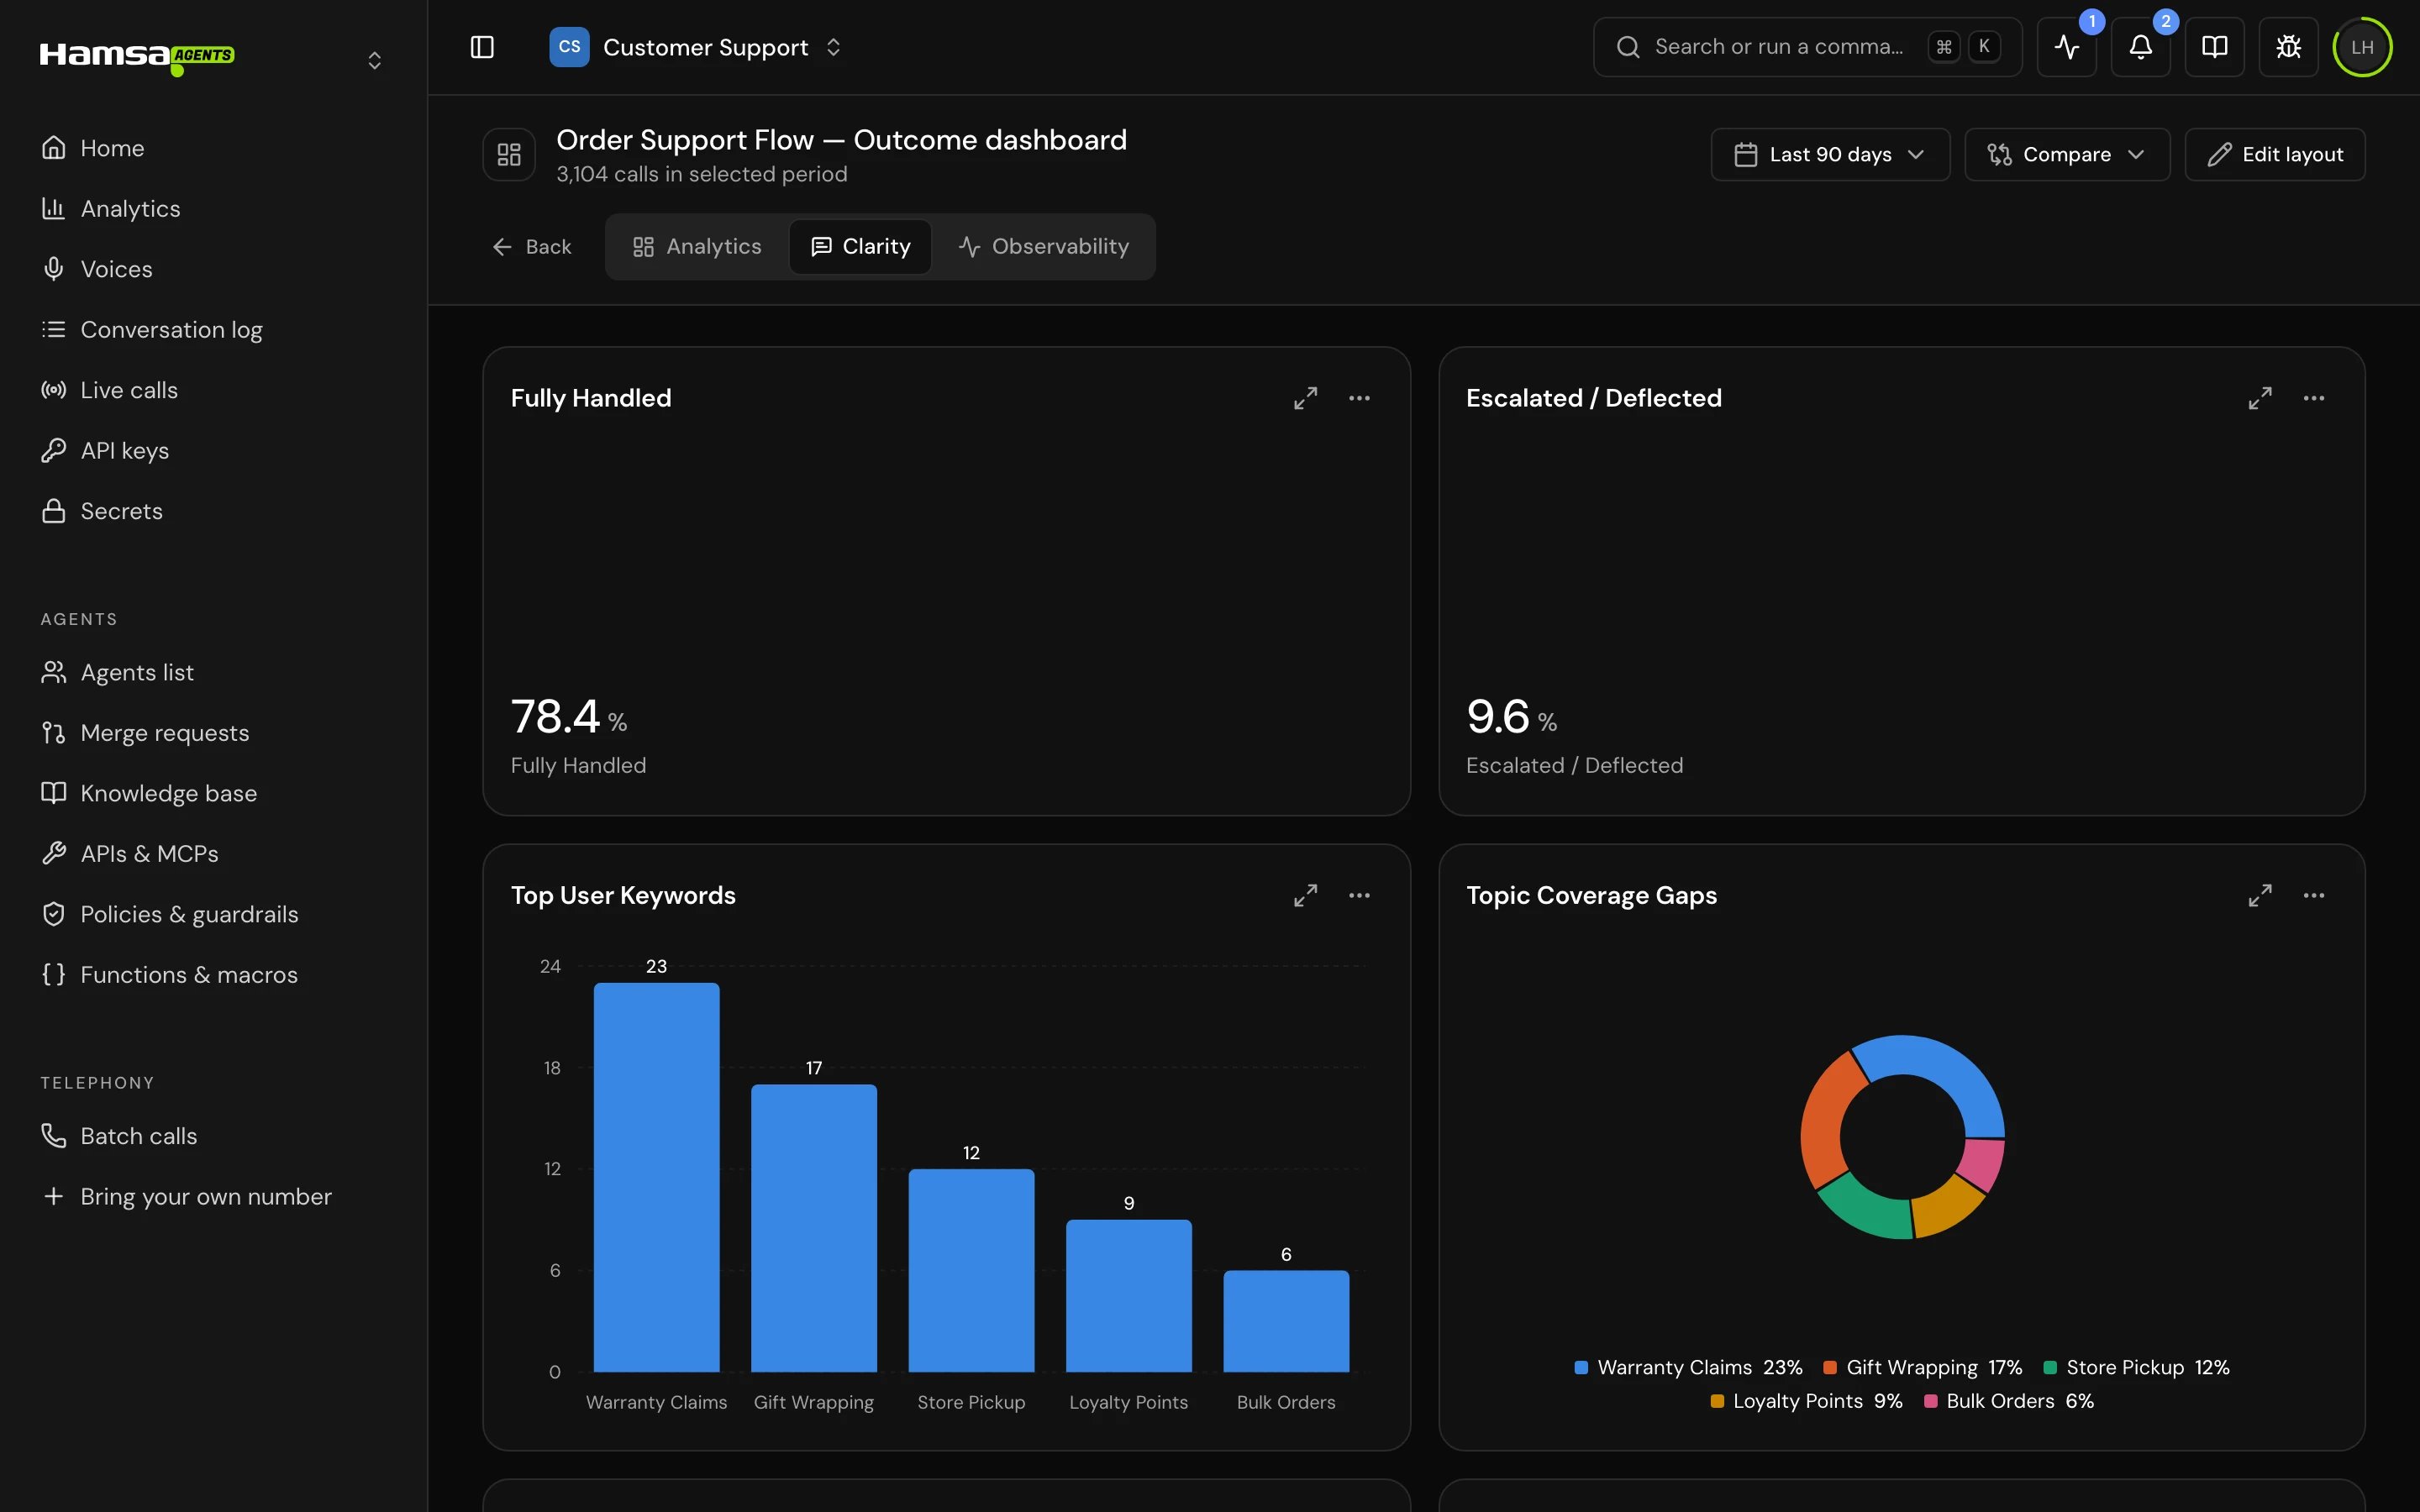
Where the agent couldn’t help, over completed and forwarded calls. These widgets are fixed, and each shows only when the agent’s calls can answer it.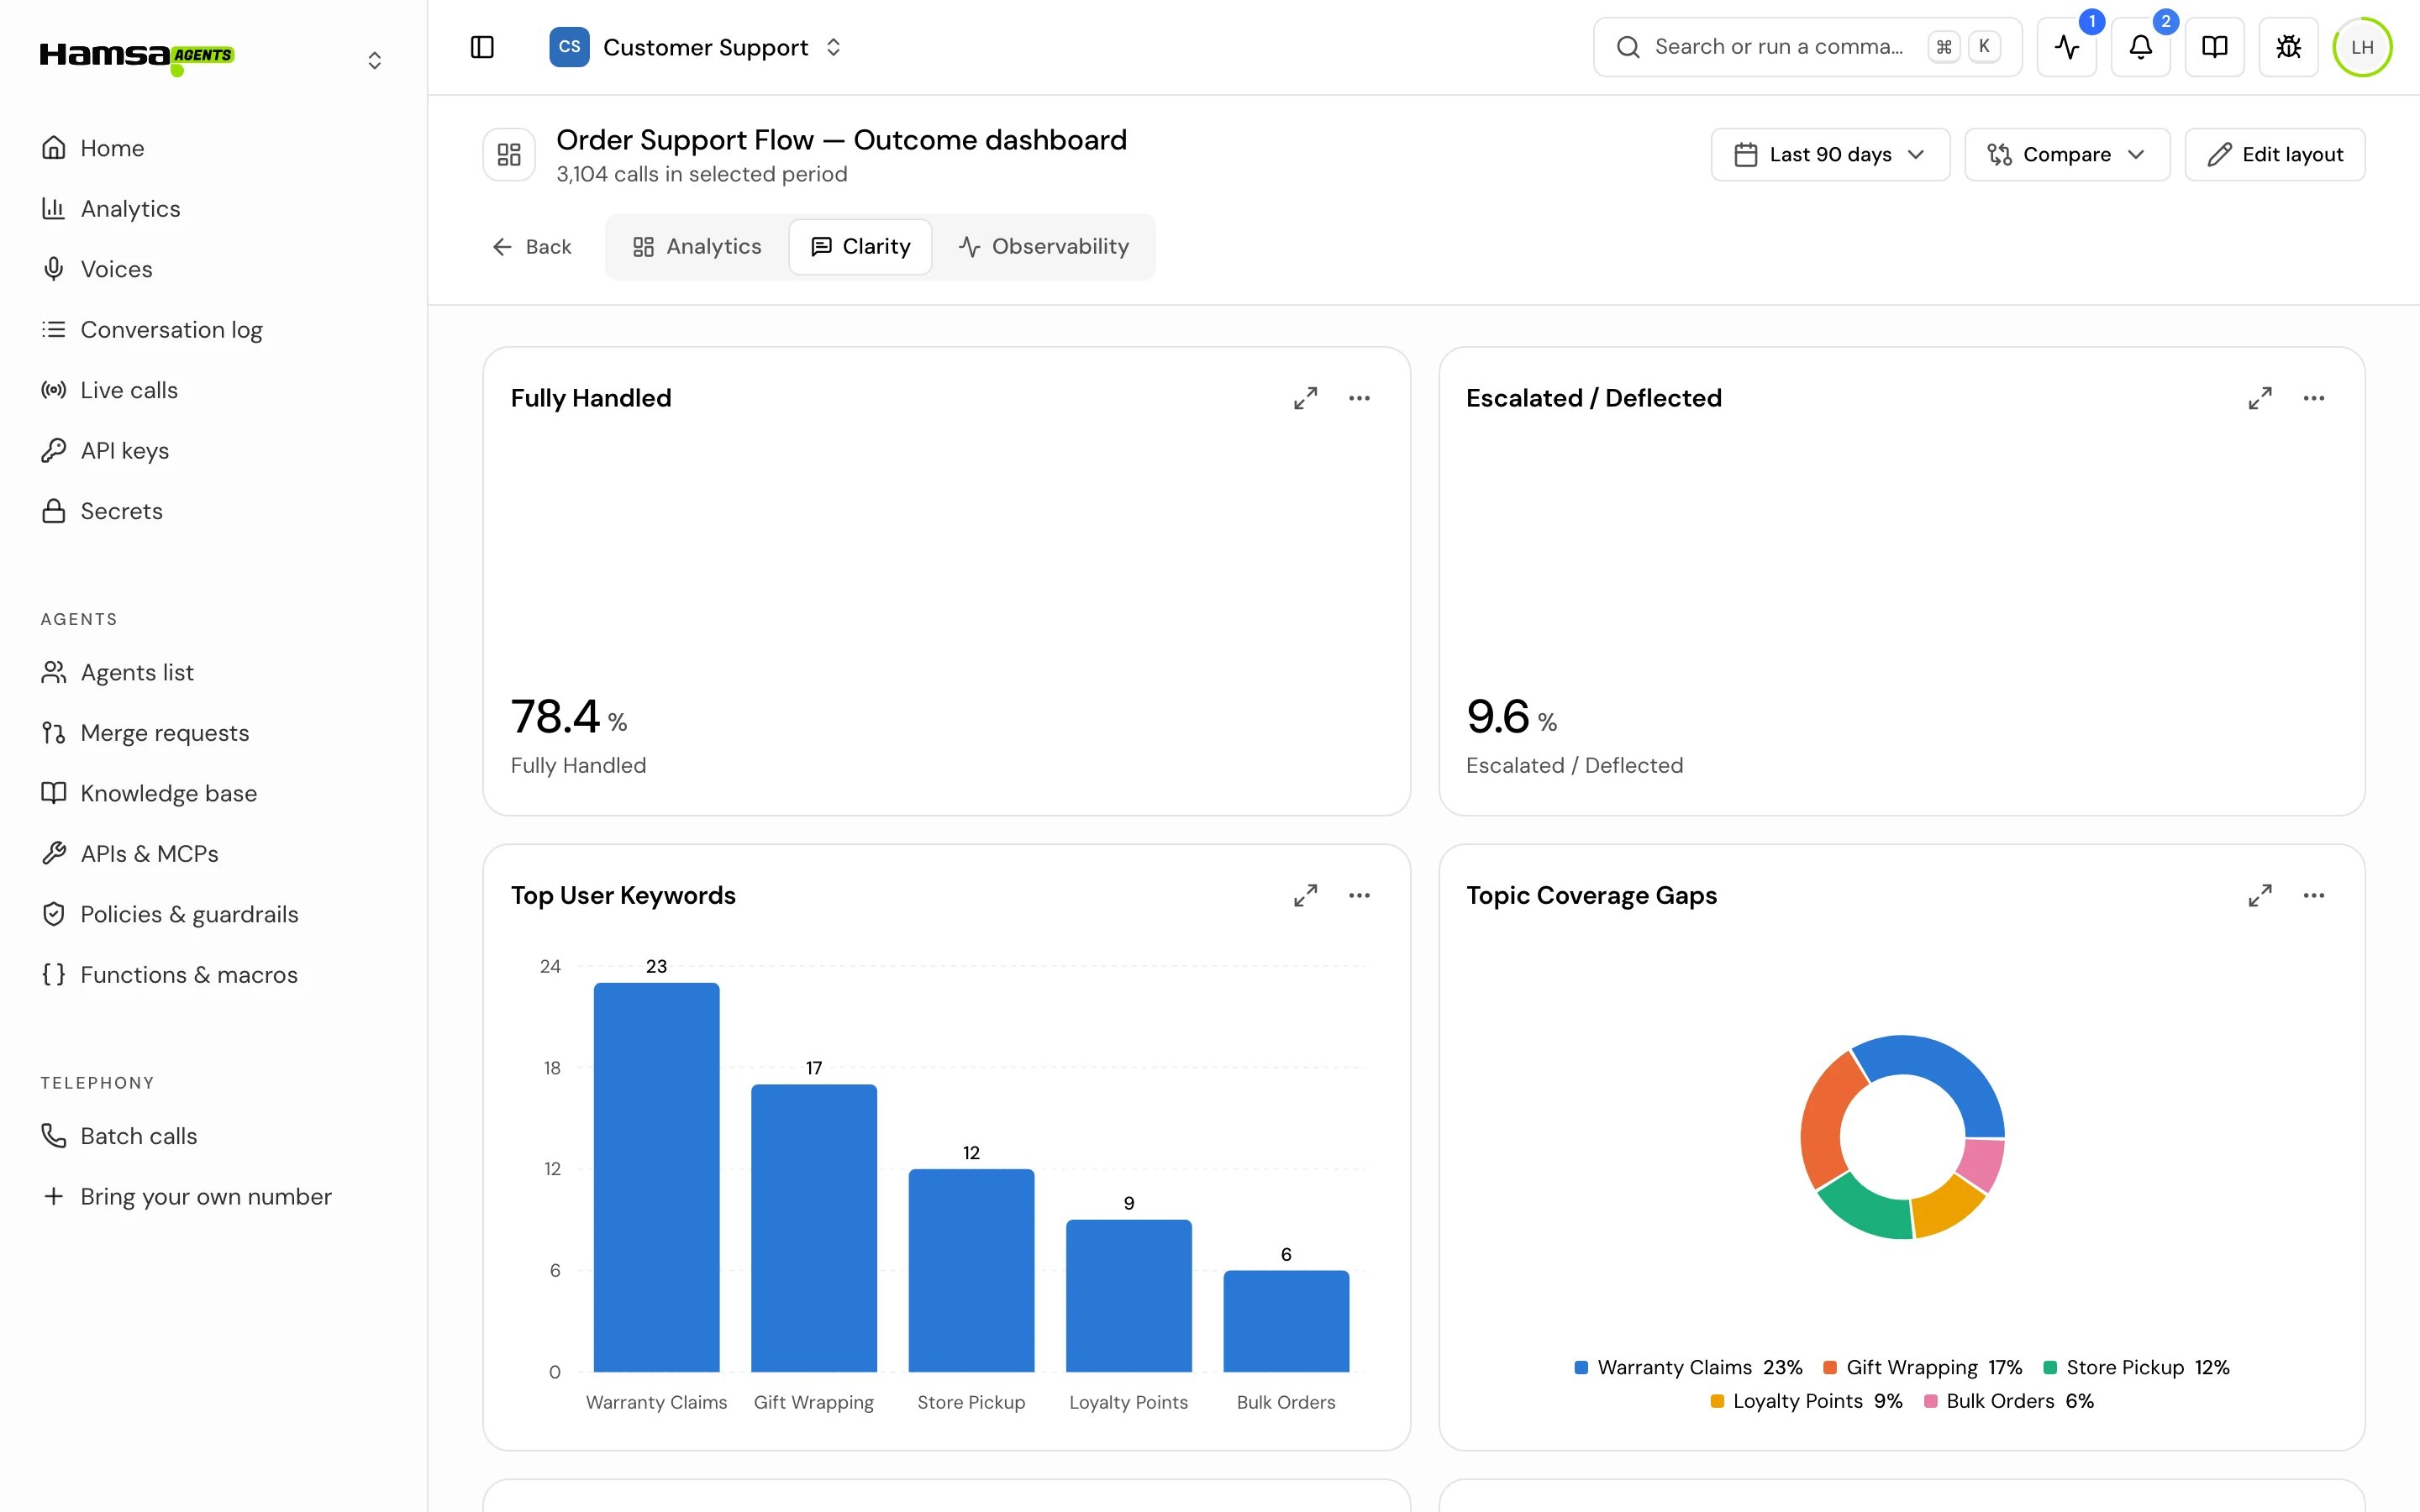
Observability
Where calls fail, over completed, forwarded and failed calls. These widgets are fixed.
A widget whose metric the agent doesn’t report shows “Not integrated”.
Add a widget
1
Open the dialog
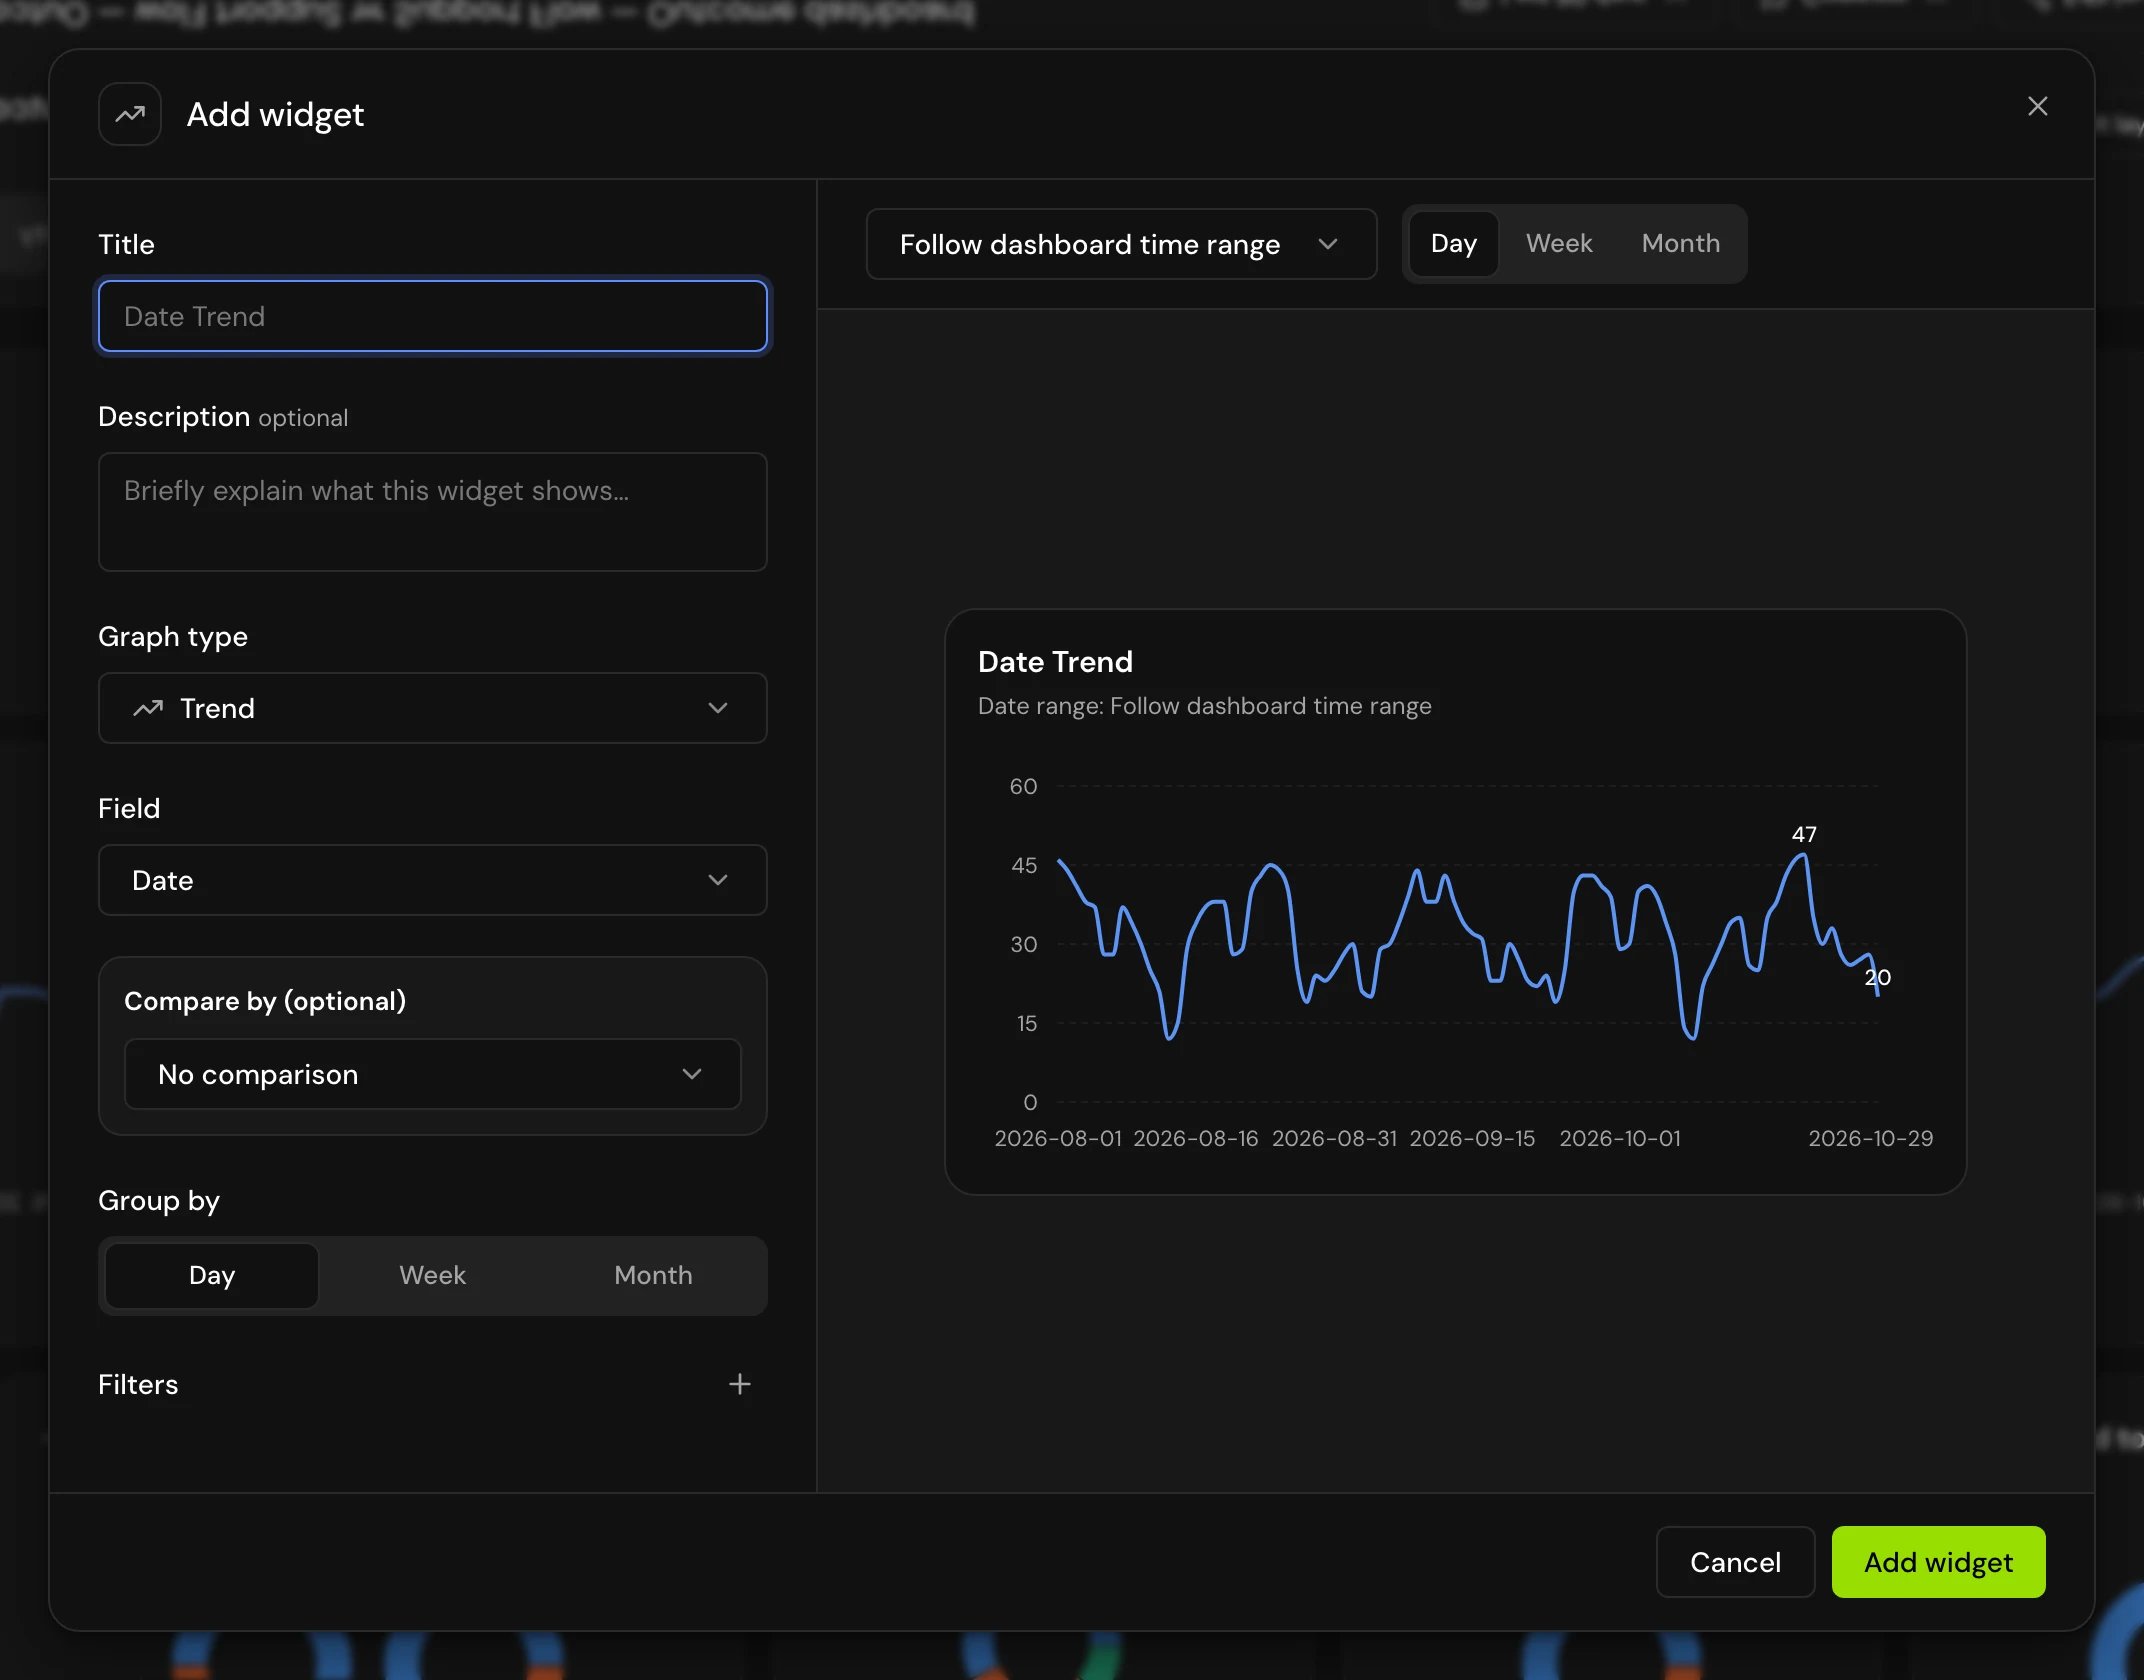
On the Analytics tab, click Add widget. On an empty dashboard, click Add your first widget.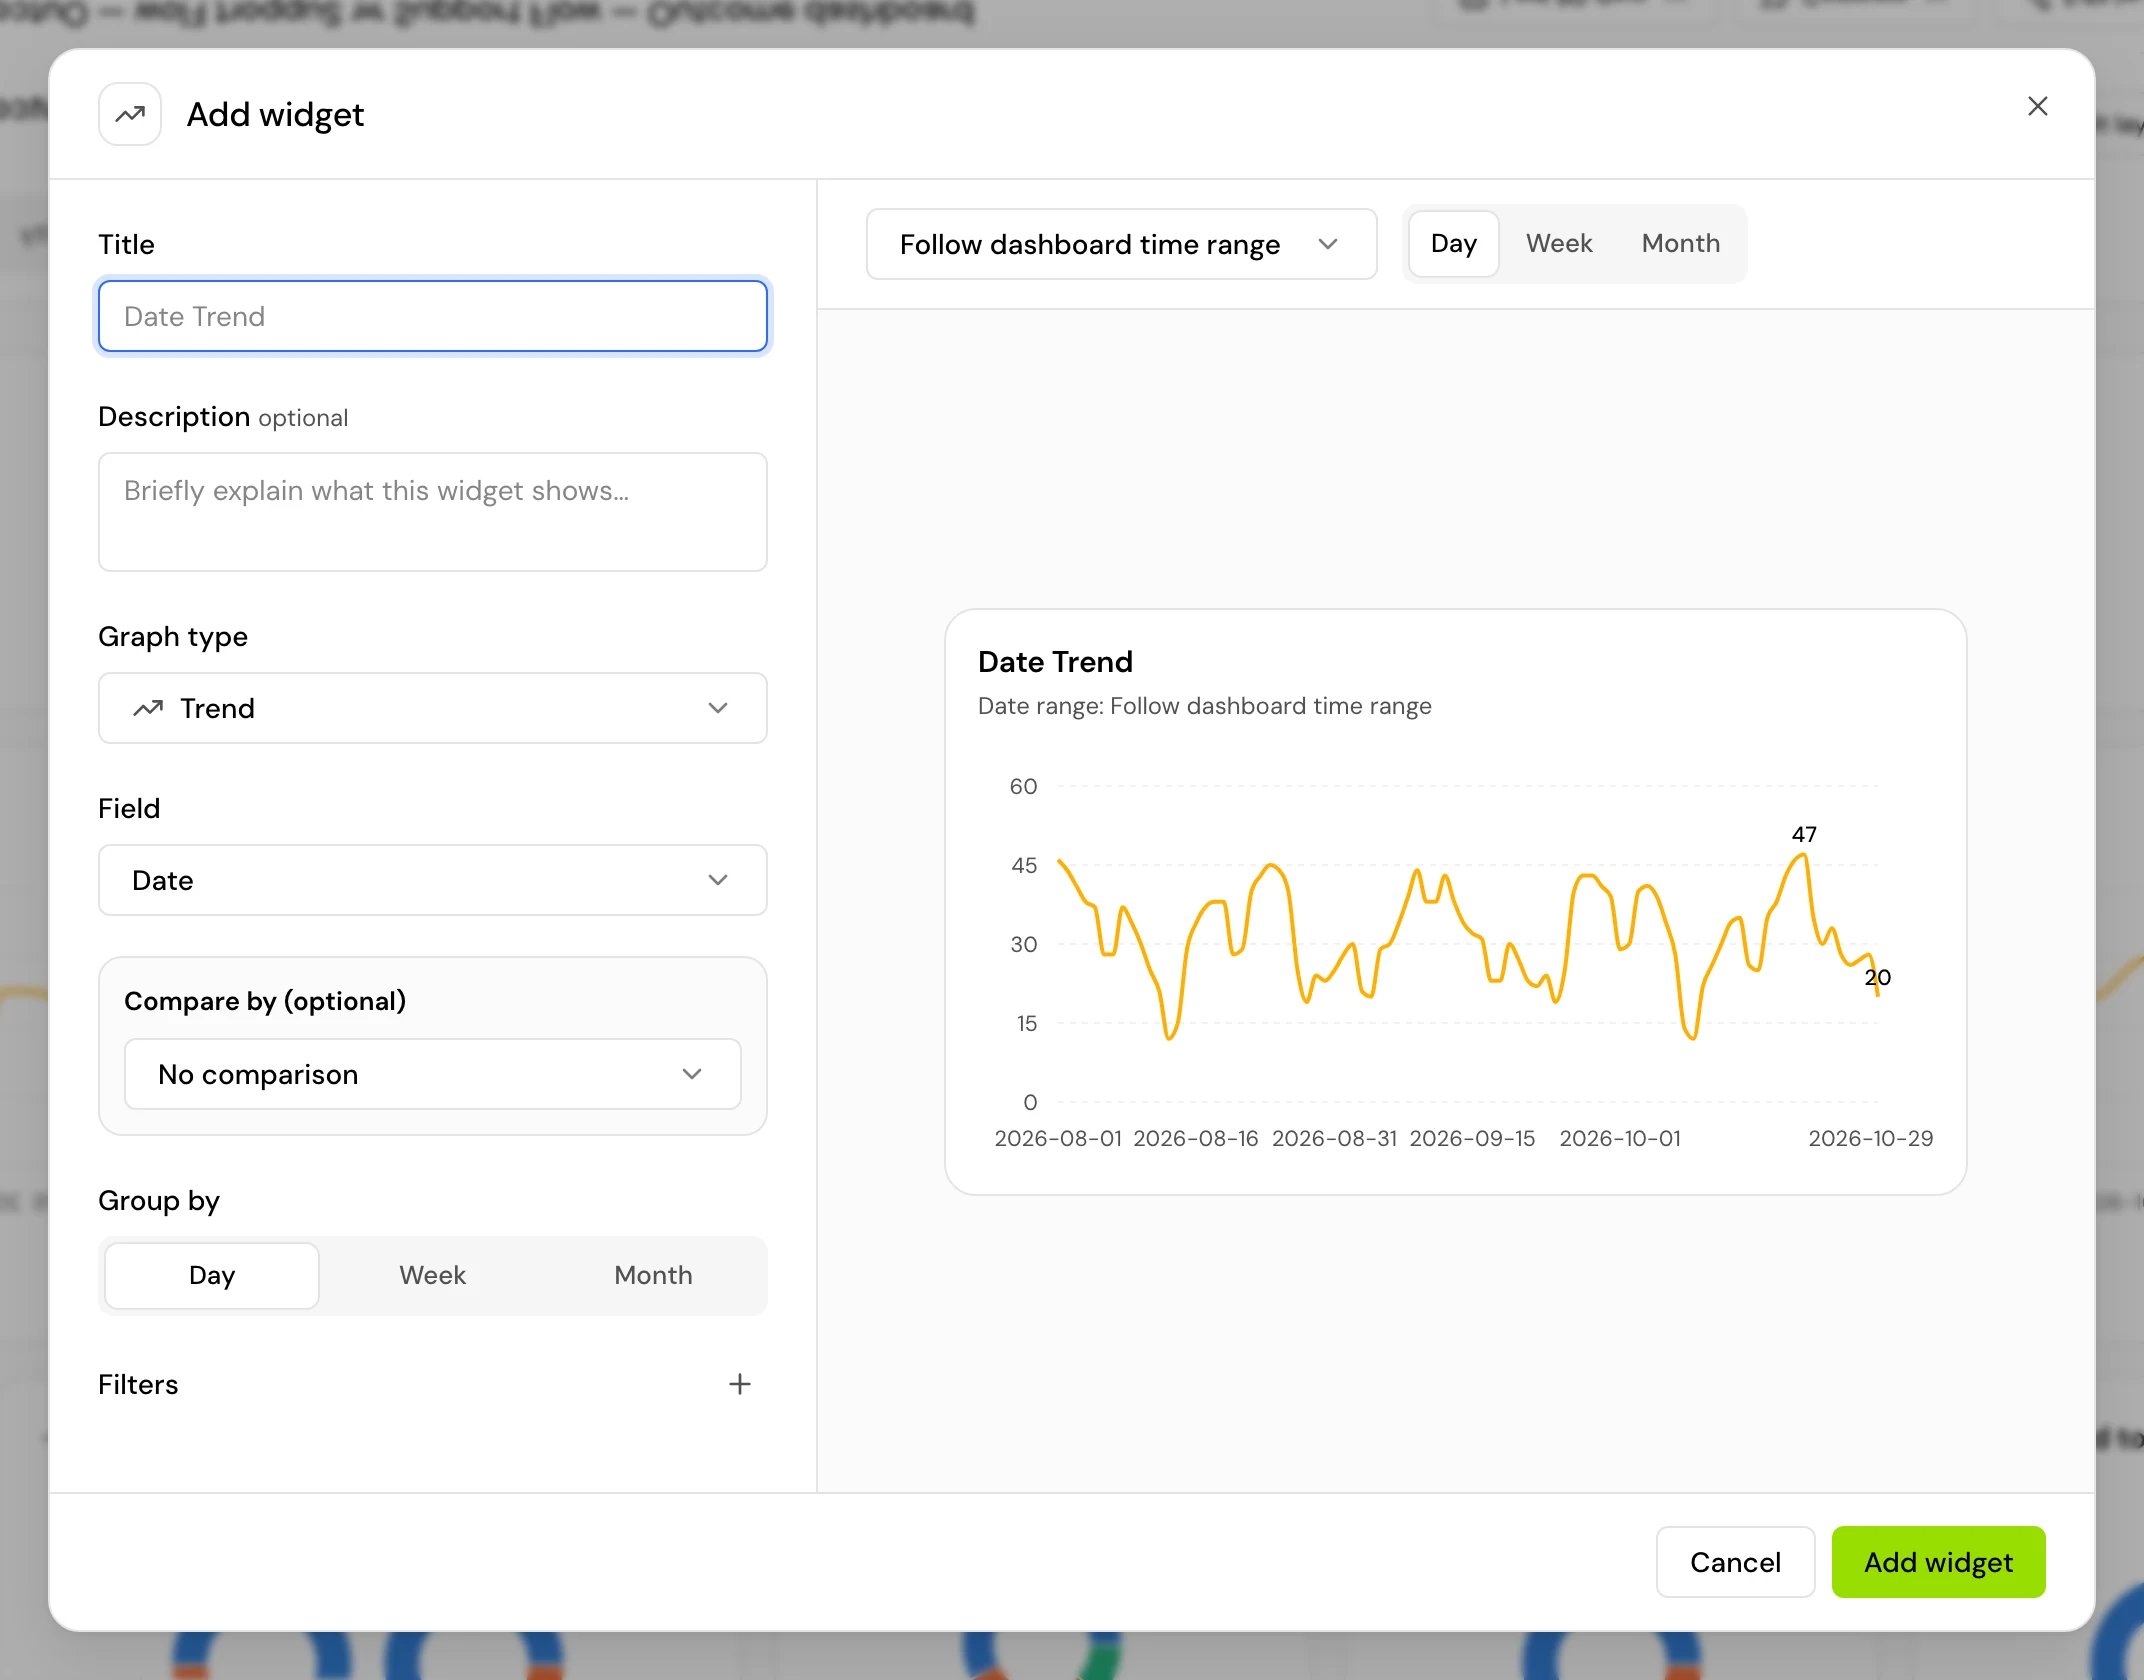
2
Pick a graph type
Under Graph type, choose Trend (the default), Bar, Donut, KPI, Table, Stacked bar, Radar or Heatmap.
3
Name it
Enter a Title, and a Description if you like.
4
Choose what to chart
Pick a Field: one of your agent’s outcome fields, or a platform field such as duration or sentiment. For a field that holds several keys, pick a Sub-field. Then pick a Measure (see below). For a trend, pick Group by: Day, Week or Month.
5
Narrow it down (optional)
Use Compare by to split the chart by another field (a stacked bar needs one) and Show only to keep some values. Add Filters: pick values From your calls, or type one (it matches the exact text, capital letters included). Set Comparison direction to say whether higher or lower is better, which colors the change when you compare periods. Set a Custom date range to give this widget its own dates.
6
Check and save
The Widget preview shows the chart as you go. Click Add widget to save it.
Measures
Change the layout
Click Edit layout, then drag widgets to reorder (Drag to reorder) or resize (Drag to resize). Click Done editing when you’re finished. Each widget’s Widget options menu has:- Expand: the widget’s data as a table.
- Edit, Duplicate and Delete (for your own widgets), or Hide (for starting widgets).
- Export CSV and Export Excel: the widget’s data.
Good to know
- Members who can view but not edit see the dashboard as it is. On an empty dashboard they see “No widgets yet”.
- Widget titles you see in English are the platform’s own names. In other languages they are translated.
- The dashboard and Analytics both count completed and forwarded calls for resolution and transfers. Analytics also counts calls in other statuses in some of its totals, so a total can differ between the two for the same agent and dates.
Related
Analytics
Figures across all your agents, and how calls are scored.
Call details
One call’s analysis and outcome fields.
Knowledge base
Fill the gaps Clarity finds.
Conversation log
The calls behind the charts.