Accessing Satisfaction Metrics
- Navigate to Dashboard from the main menu
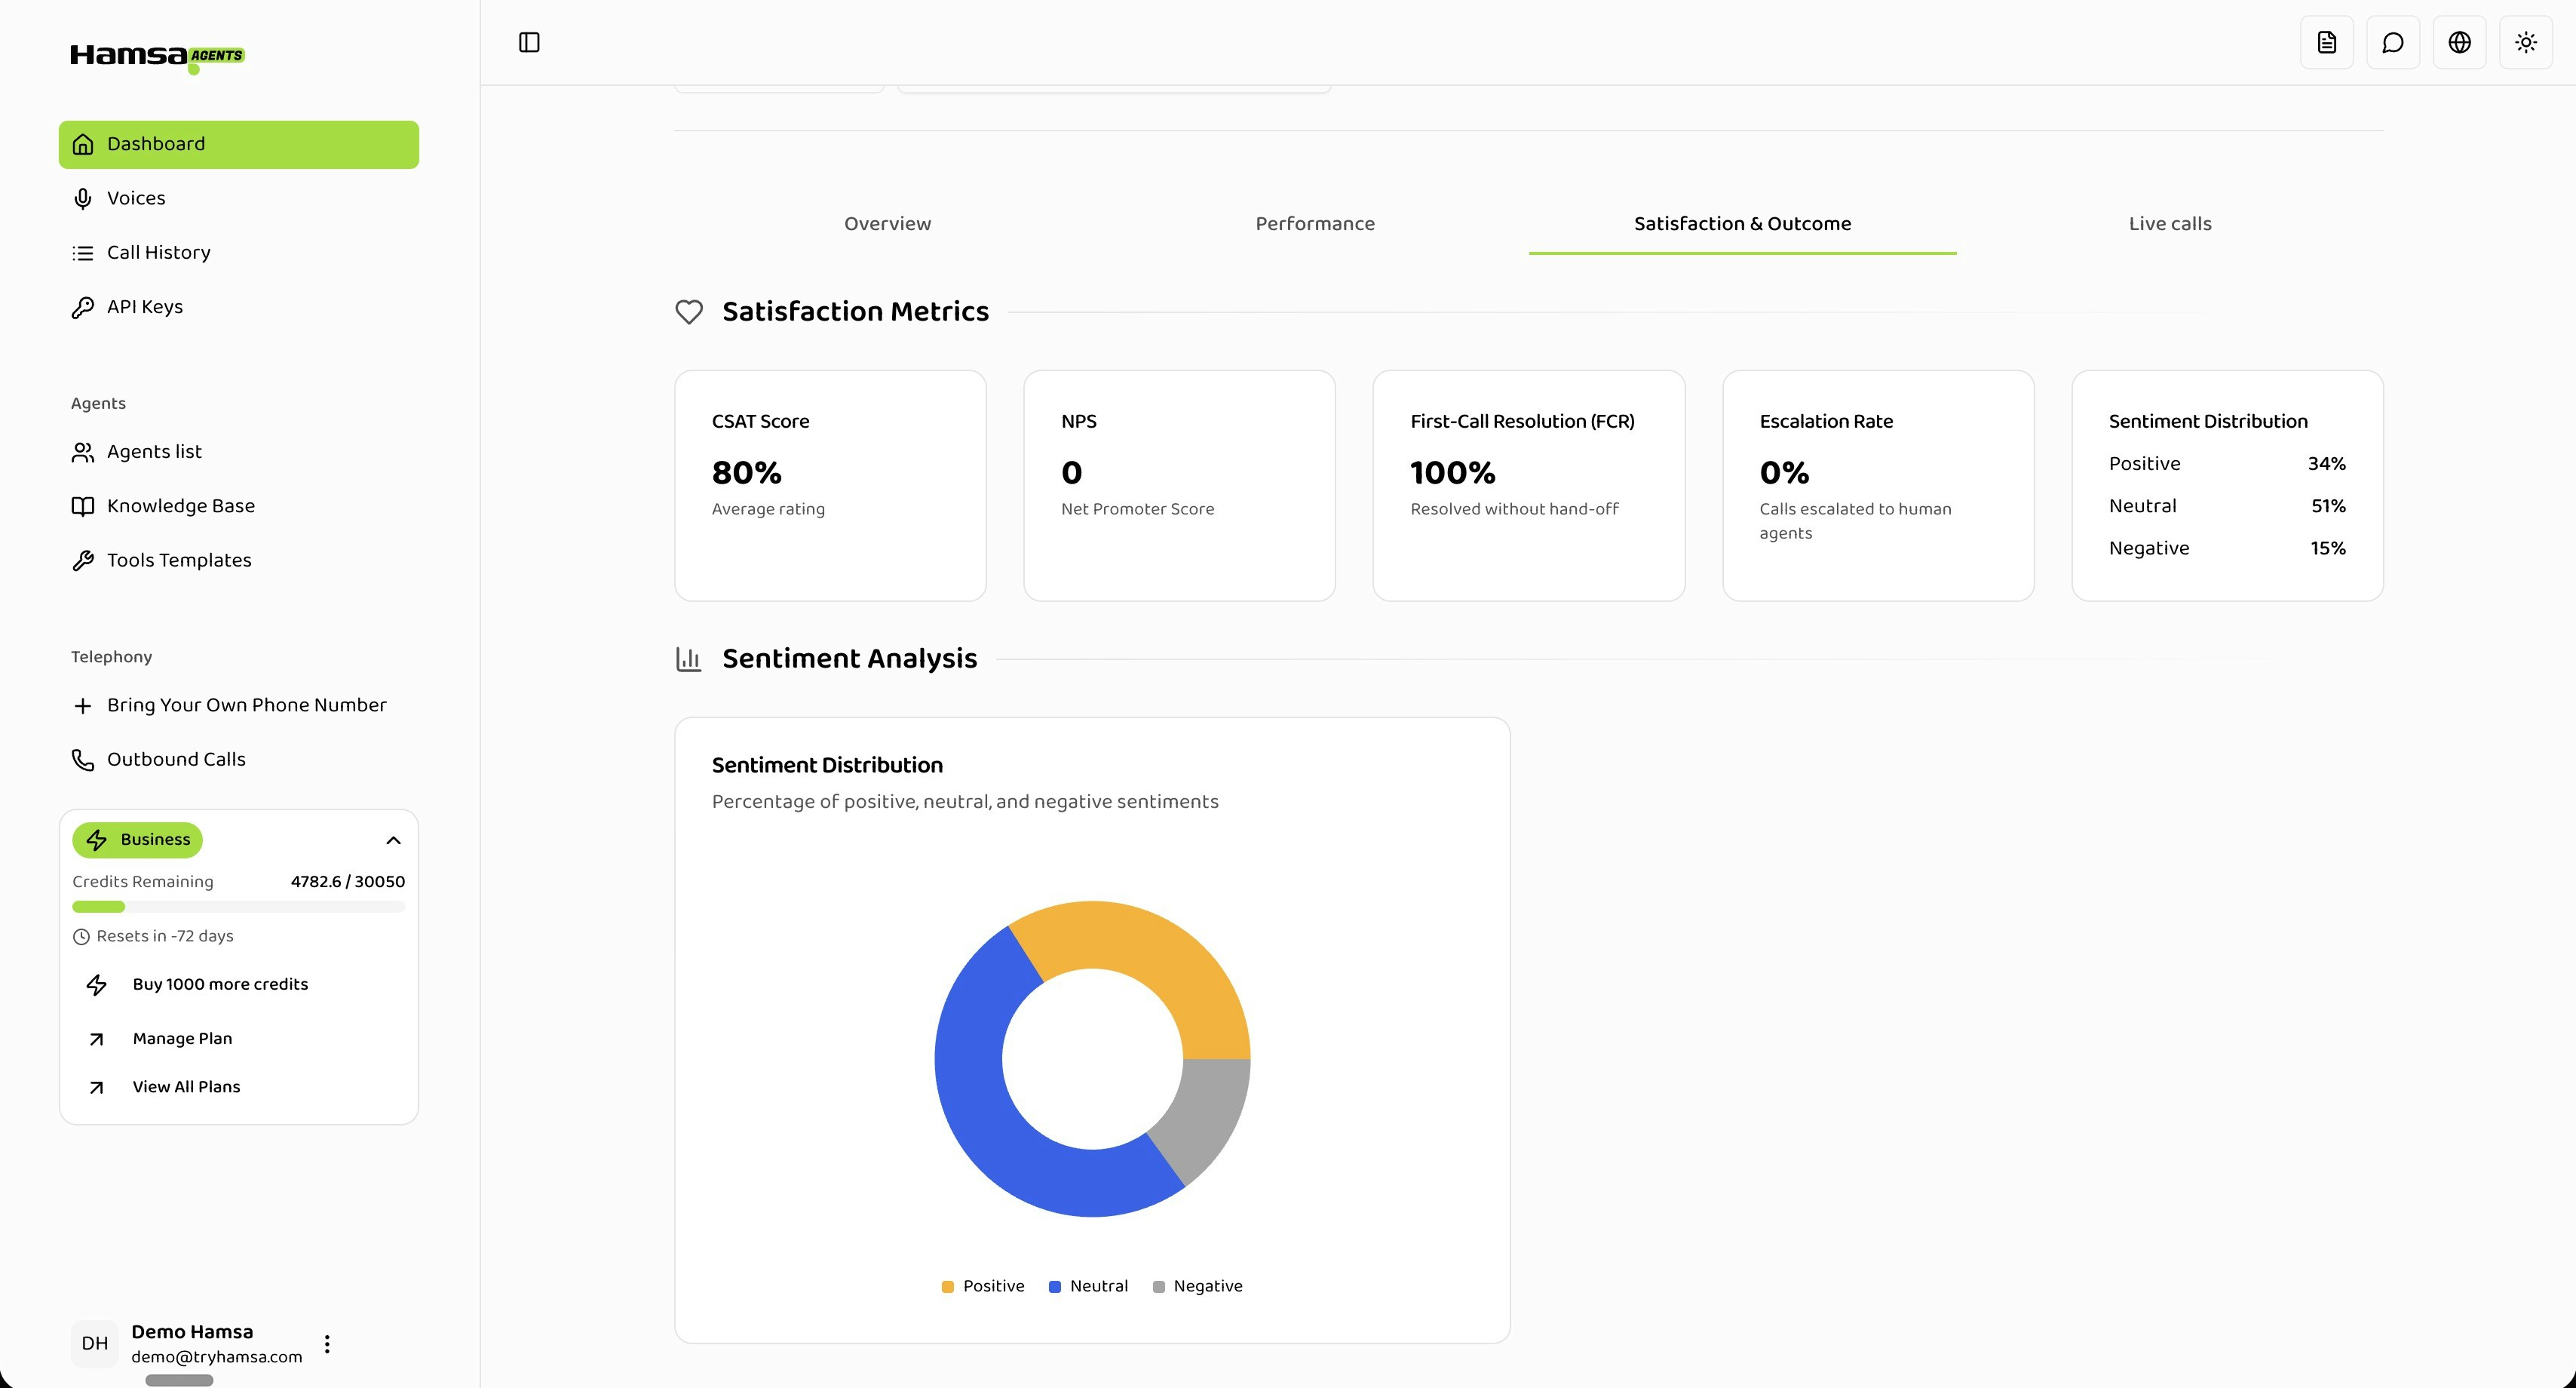
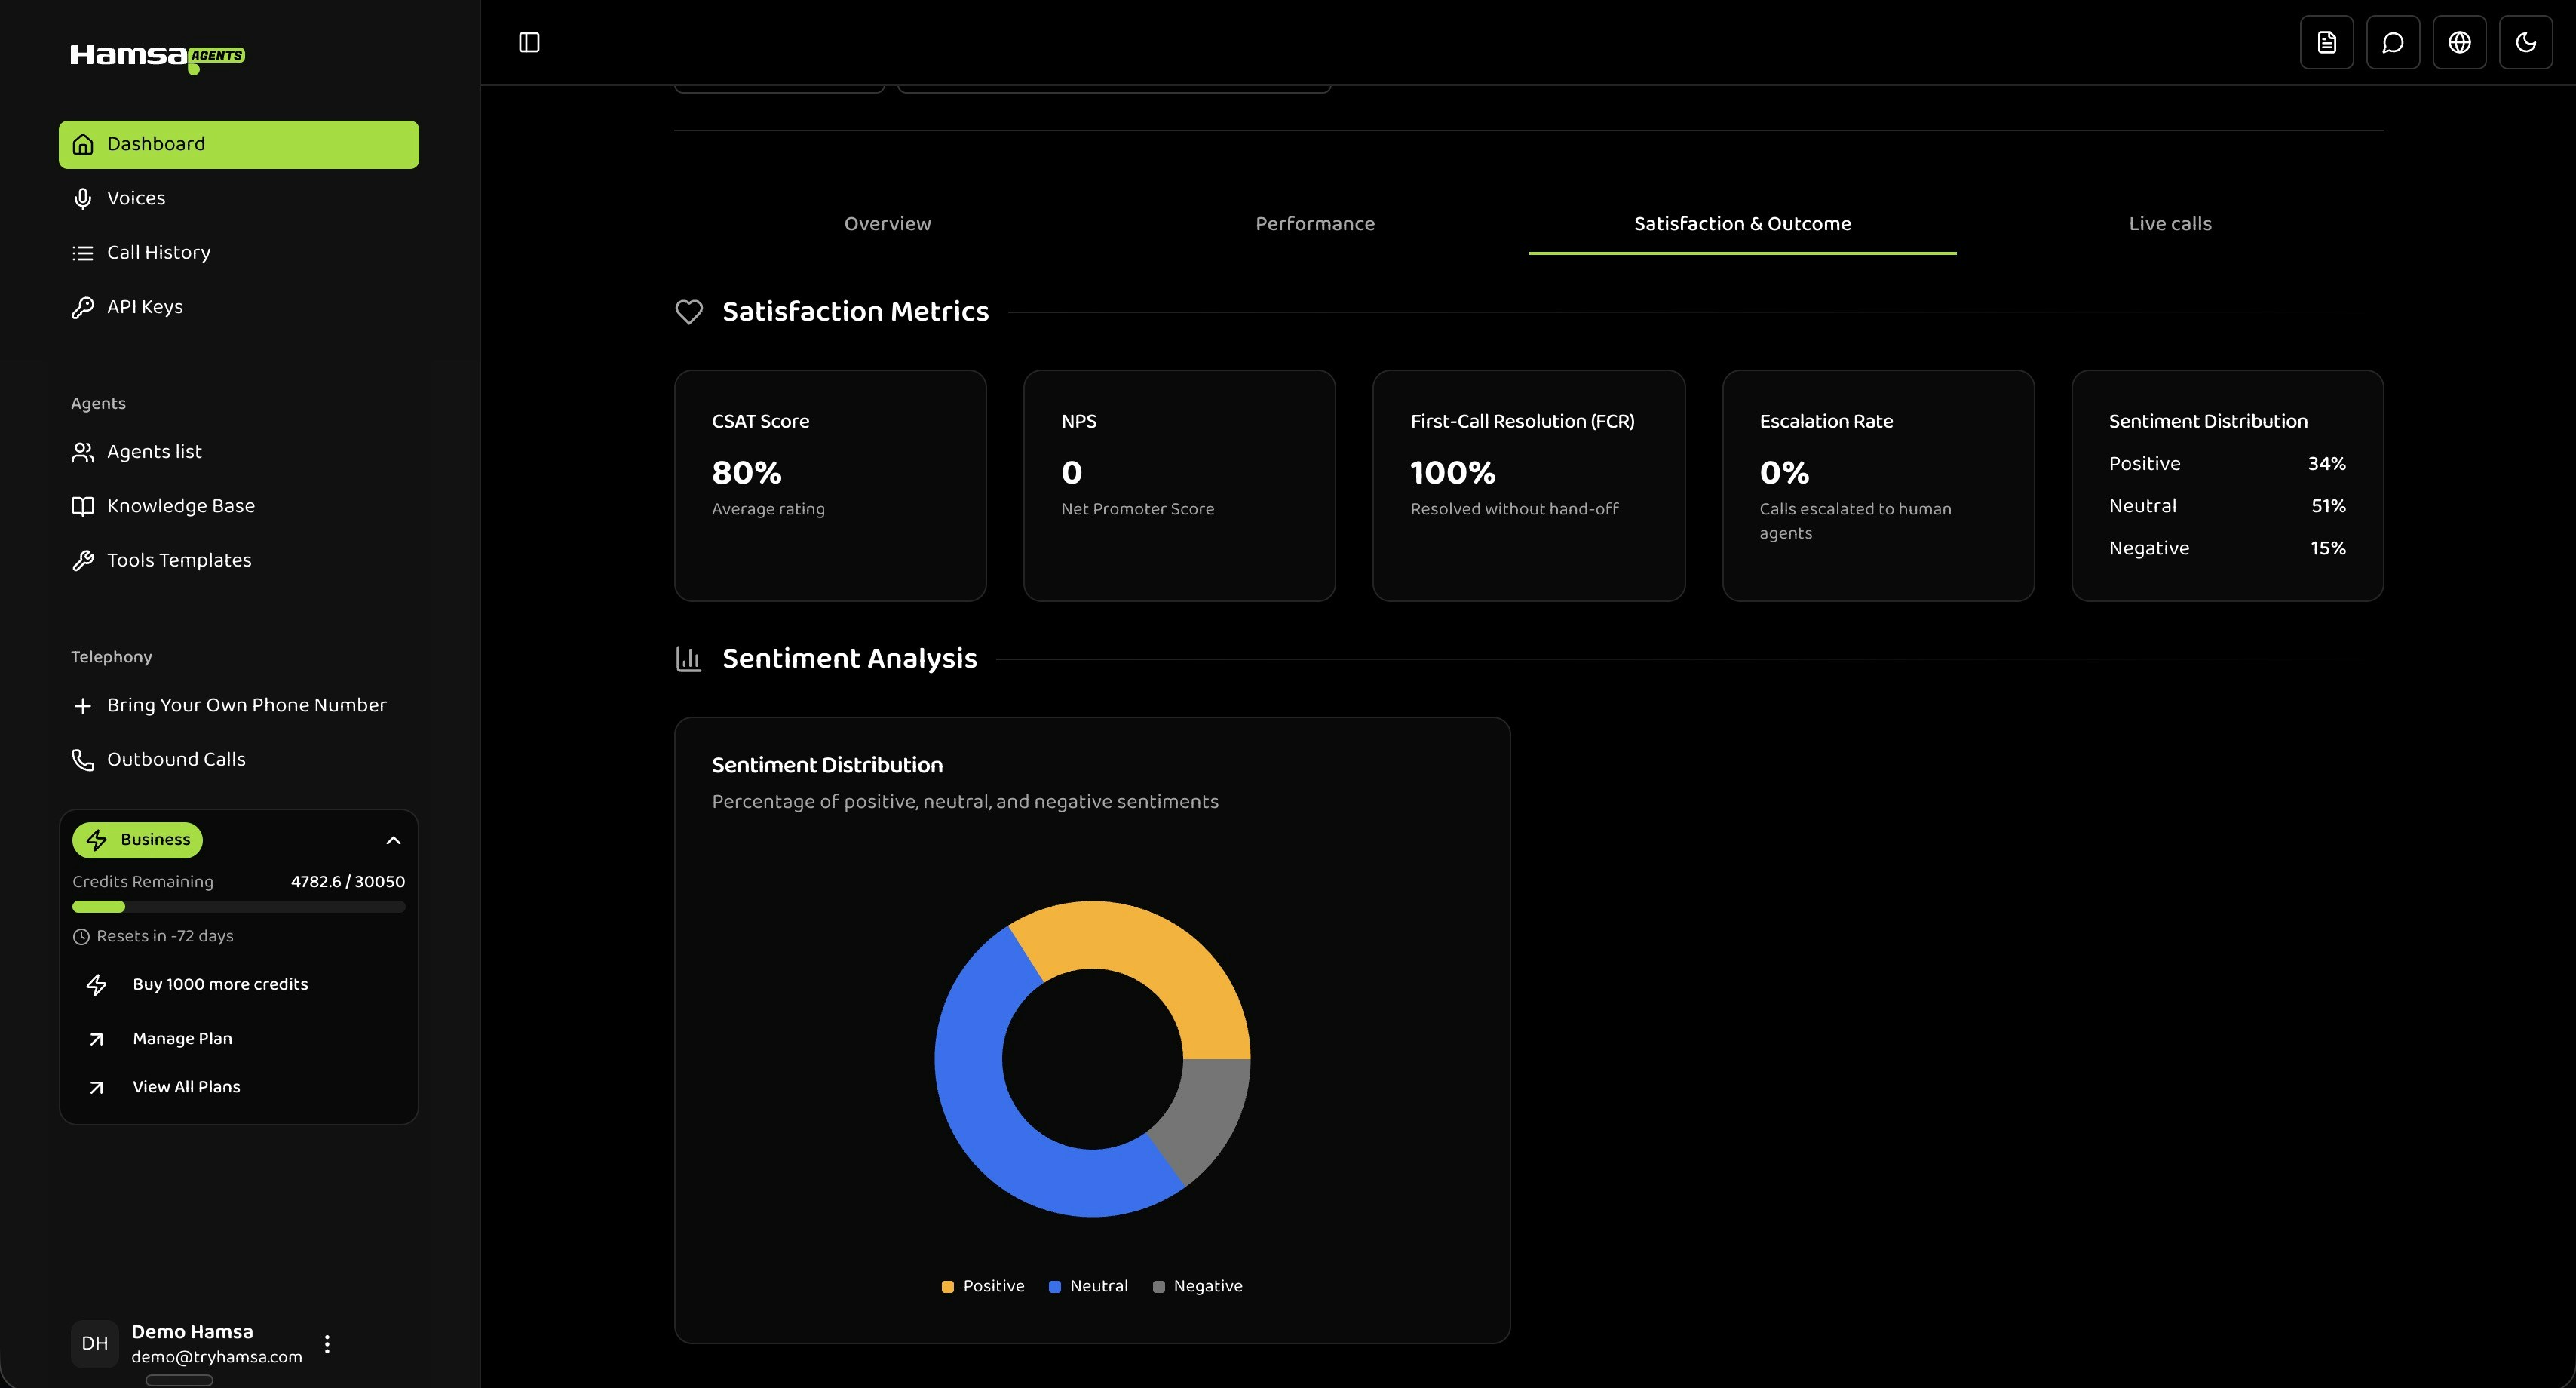
- Click the Satisfaction & Outcome tab
- Apply filters to analyze specific segments:
- Agent Filter: Compare satisfaction across agents
- Date Range: Track trends over time
Key Metrics
CSAT Score
What it measures: Customer Satisfaction Score — the percentage of calls that received a positive satisfaction rating from post-call surveys. As a reference, here are typical ranges:- > 85%: Excellent
- 75% - 85%: Good
- 65% - 75%: Room for improvement
- < 65%: Investigate
NPS (Net Promoter Score)
What it measures: How likely customers are to recommend your service, on a scale of 0-10. How it’s calculated:- > 50: Excellent
- 30 - 50: Good
- 0 - 30: Acceptable
- < 0: More detractors than promoters — investigate
First-Call Resolution (FCR)
What it measures: Percentage of calls handled entirely by the AI agent without being transferred to a human.- > 80%: Excellent
- 70% - 80%: Good
- 60% - 70%: Acceptable
- < 60%: Investigate
FCR and Escalation Rate are inversely related. High FCR means the agent is handling most queries independently.
Escalation Rate
What it measures: Percentage of calls that required transfer to a human agent.- < 10%: Excellent — agent handles most queries
- 10% - 20%: Normal for customer support use cases
- 20% - 30%: Acceptable for complex domains
- > 30%: High — agent may need expanded capabilities
Sentiment Distribution
What it measures: The emotional tone of customer conversations, analyzed from transcripts. Displayed as: A donut chart with three segments:- Positive: Satisfied, grateful
- Neutral: Matter-of-fact, transactional
- Negative: Frustrated, upset
Sentiment analysis must be enabled per agent before data appears here. It is off by default. You can turn it on in your agent’s settings.
- Positive: 60-70%
- Neutral: 20-30%
- Negative: 5-15%
Reading the Sentiment Chart
The donut chart uses color-coded segments:- Yellow-Orange: Positive sentiment
- Blue: Neutral sentiment
- Gray: Negative sentiment
- A growing red segment over time suggests declining experience
- A dominant gray segment may indicate the agent is functional but not engaging
- A sudden shift in any direction warrants investigation
Improving Your Metrics
These metrics reflect how well your agent serves customers. Here’s what you can adjust:Improve Resolution and Reduce Escalations
- Expand your knowledge base: If the agent can’t answer common questions, add that information
- Add tool integrations: Give the agent access to systems it needs (order lookup, account info, etc.)
- Refine escalation triggers: Configure when the agent should hand off vs. attempt to resolve
- Update conversation flows: If customers frequently get stuck at specific points, improve the flow
Improve Satisfaction and Sentiment
- Improve prompt instructions: Guide the agent’s tone, empathy, and thoroughness
- Keep responses concise: Long-winded answers frustrate callers
- Choose the right model: More capable models (GPT-4.1, Gemini 2.5-Pro) handle nuanced conversations better
- Set clear expectations: If the agent can’t do something, it should say so early rather than frustrating the caller
Compare Agents to Find What Works
Use the agent filter to view metrics for individual agents. If one agent performs significantly better than another:- Review its configuration (prompt, model, knowledge base)
- Identify what’s different from lower-performing agents
- Apply those patterns where appropriate
The agent filter is single-select — switch between agents to compare their metrics. When comparing, account for differences in complexity. A simple FAQ agent will naturally have higher FCR and CSAT than one handling complex support queries.
Filtering and Trends
By Date Range
Use date range comparisons to spot trends:- Today vs Yesterday: Detect sudden changes
- This Week vs Last Week: Identify trends
- Custom range: Investigate specific incidents or measure the impact of changes you’ve made
By Agent
Filter by specific agents to understand per-agent performance. This is particularly useful after making configuration changes to verify they had the intended effect.Troubleshooting
Metrics Not Loading
- Expand the date range — there may not be enough data in the selected period
- Select “All agents” to check if data exists for any agent
- Verify calls have been made in the selected period
- If the issue persists, contact support
Conflicting Metrics
Sometimes metrics seem contradictory (e.g., high FCR but low CSAT). Common explanations:- High FCR, Low CSAT: The agent may be marking calls as resolved without truly satisfying the customer. Review the agent’s conversation flow.
- Low Escalation, High Negative Sentiment: The agent may not be escalating when it should. Consider adjusting escalation triggers for frustrated callers.
- Good Sentiment, Low FCR: The agent may be pleasant but unable to solve problems. Expand its knowledge base or tool access.
API Reference
Get Satisfaction Analytics
Retrieve satisfaction scores, sentiment distribution, and outcome metrics programmatically.
Related
Dashboard Overview
View overall system activity and session metrics
Performance Metrics
Analyze technical performance and response times
Live Calls
Monitor active calls in real-time
Call History
Review individual call transcripts and outcomes