Accessing Performance Metrics
- Navigate to Dashboard from the main menu
- Click the Performance tab
- Use the top filters to refine your view:
- Agent Filter: Select a specific agent or “All agents”
- Date Range: Choose the time period for analysis
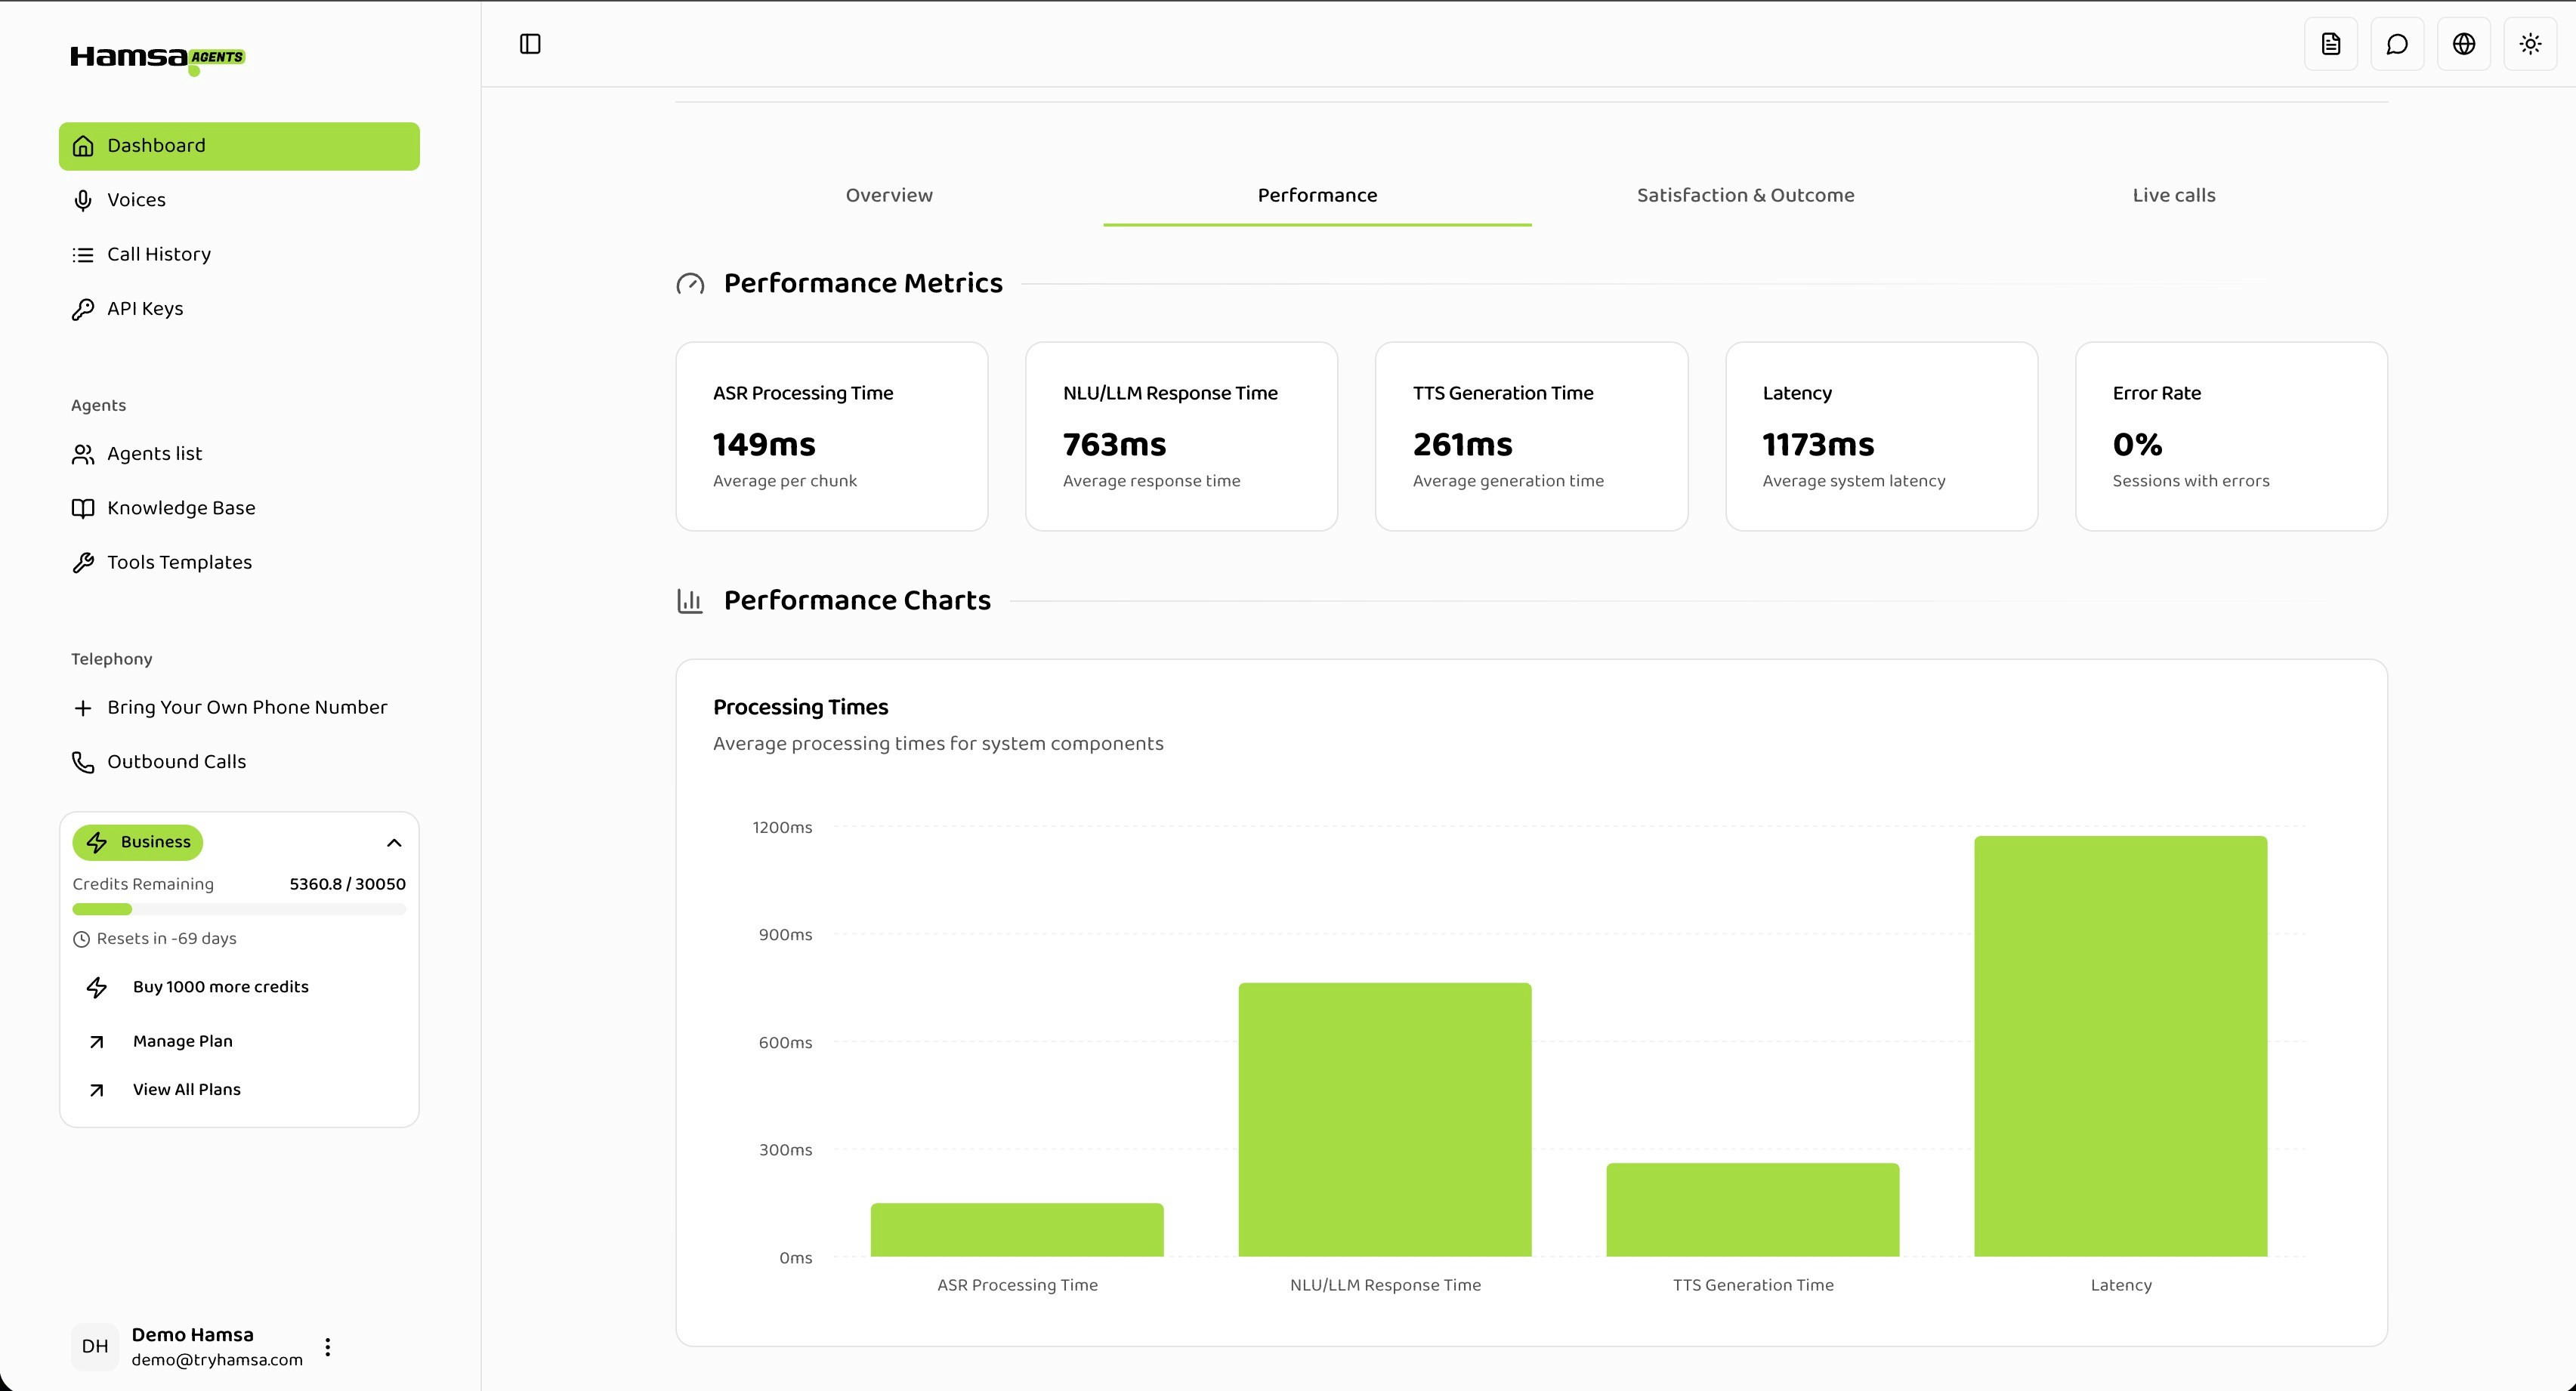
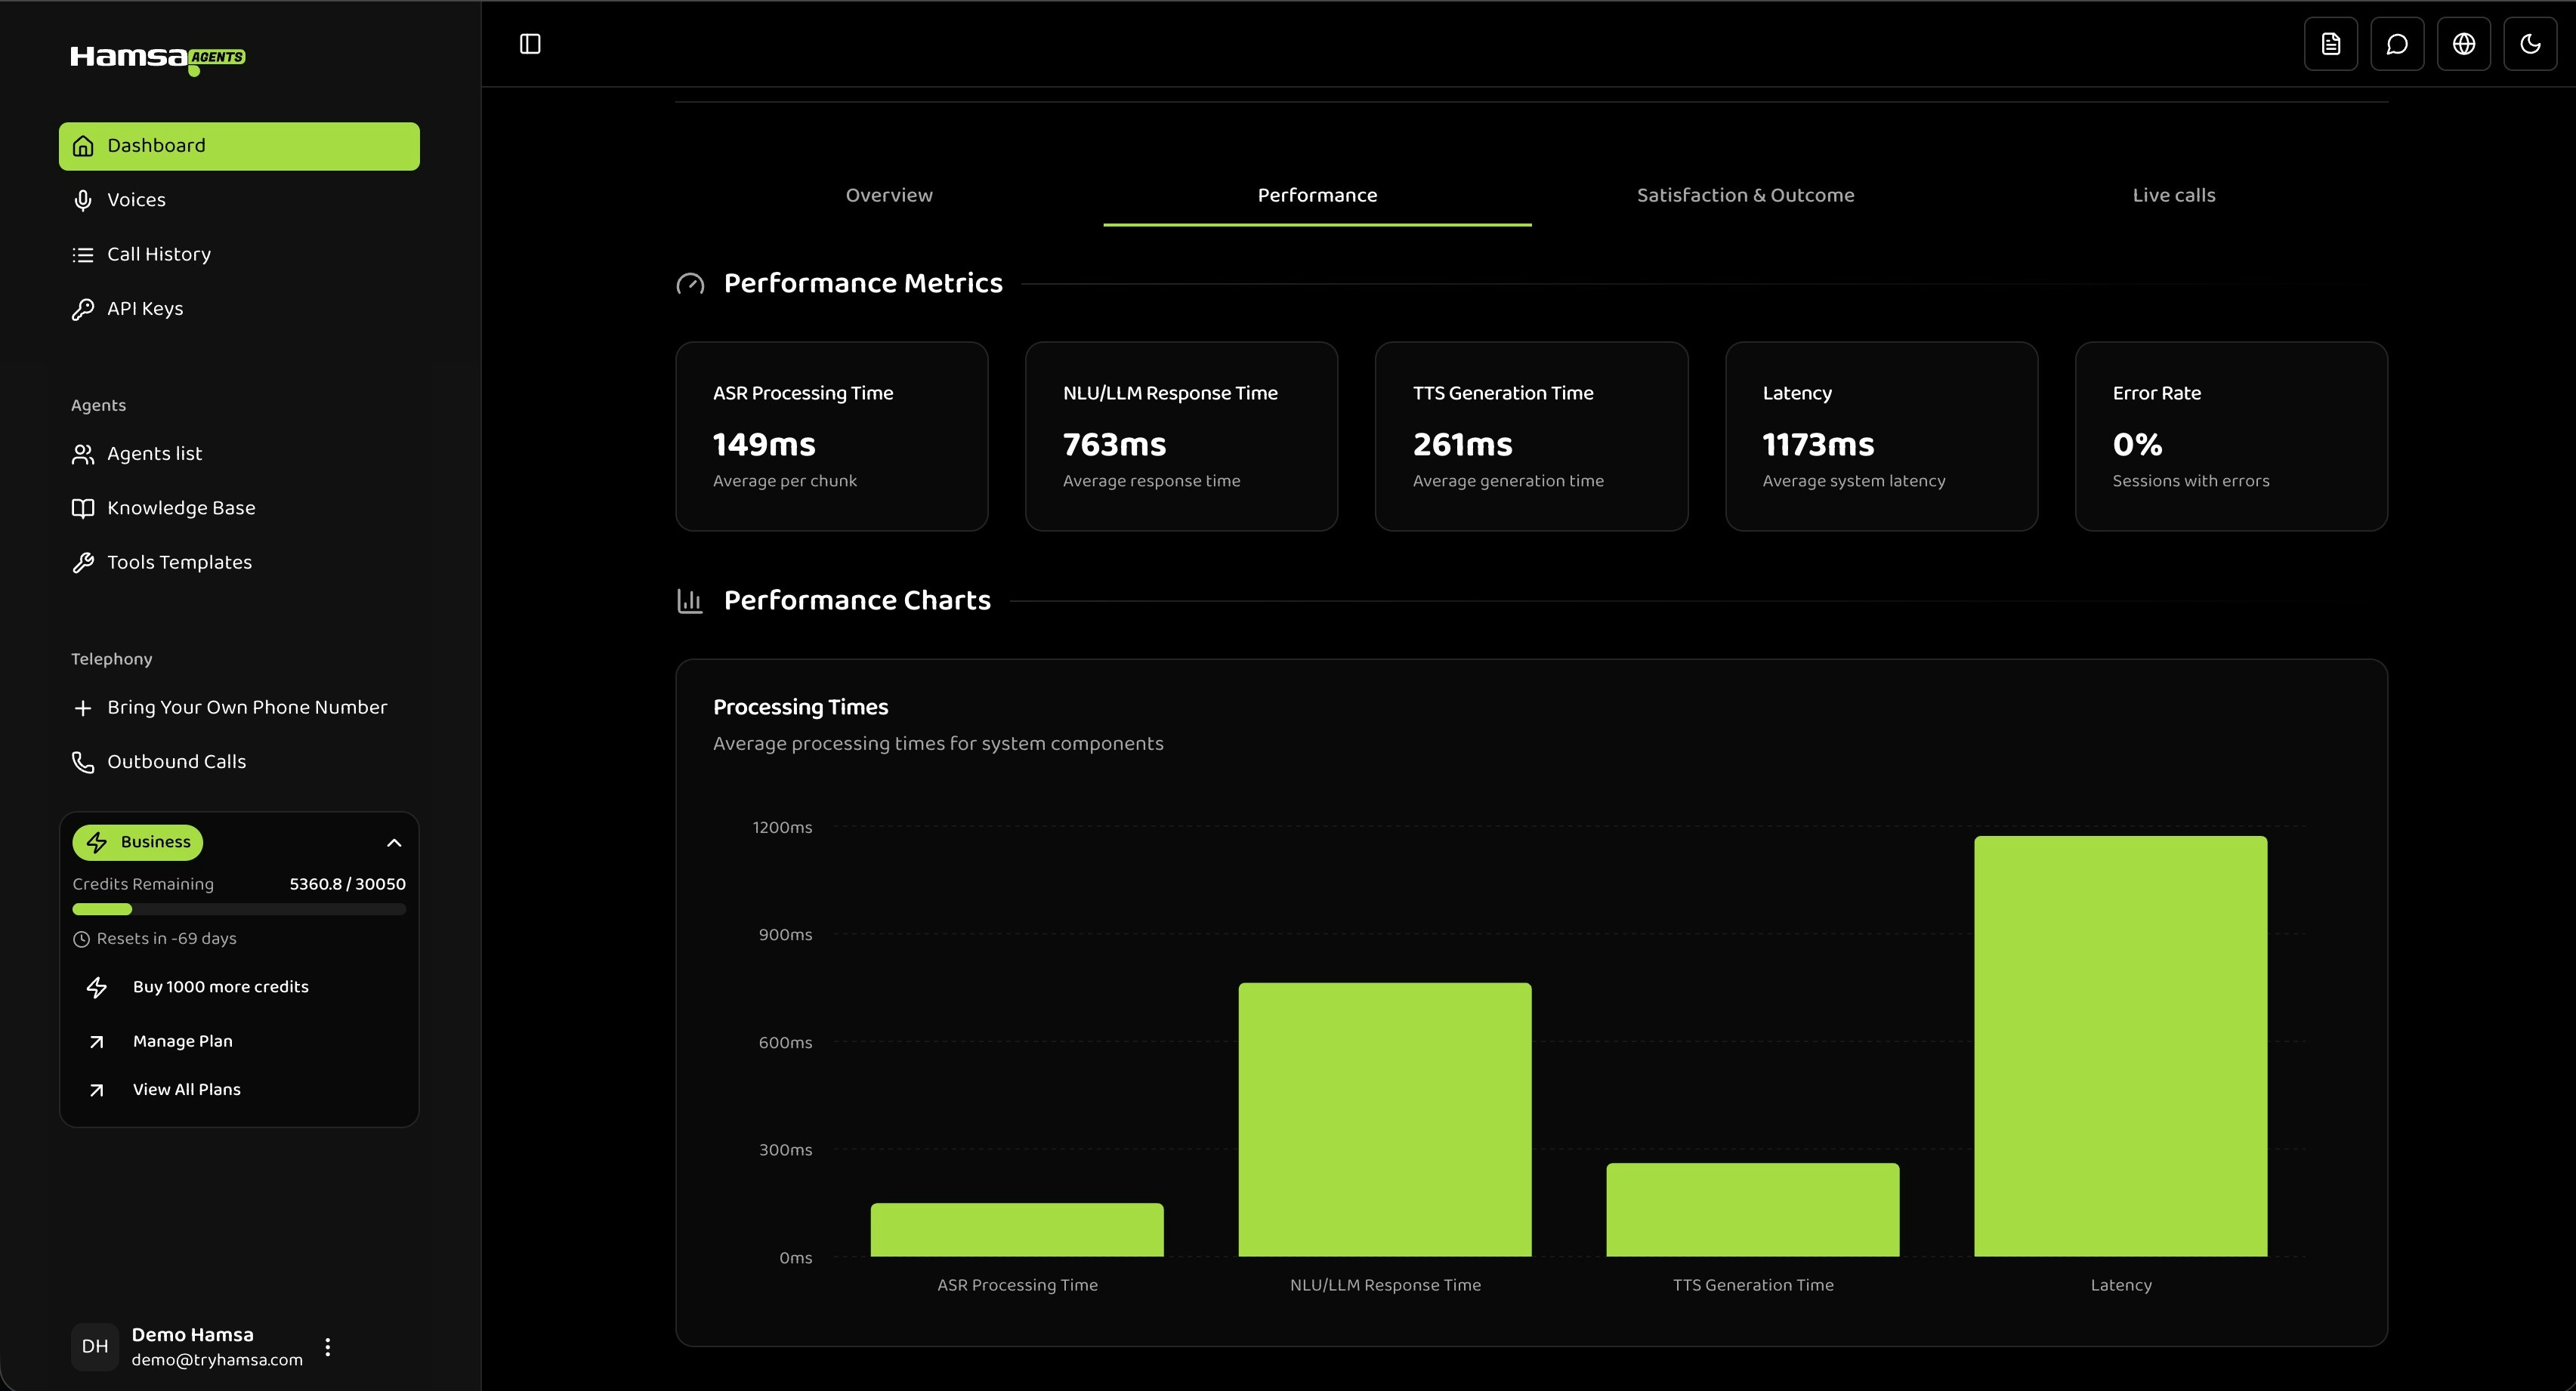
Key Metrics
The Performance tab displays five metrics that measure different aspects of your agent’s speed and reliability.ASR Processing Time
What it measures: Time to convert the caller’s speech to text (Automatic Speech Recognition). This is the time between the caller finishing speaking and the system having a text transcription ready. Hamsa’s ASR engine handles this processing automatically. As a reference, here are typical ranges:- 150ms - 300ms: Normal
- 300ms - 500ms: Acceptable
- > 500ms: Investigate
If you consistently see high ASR times, this may indicate an issue on our end. Contact support if ASR processing time regularly exceeds 500ms.
LLM Response Time
What it measures: Time for the AI language model to generate a response after receiving the transcribed text. This is typically the largest portion of overall latency and the metric you have the most control over. It depends on which model you’ve selected and how your prompts are configured. As a reference, here are typical ranges:- < 1,000ms: Fast
- 1,000ms - 2,000ms: Normal
- 2,000ms - 3,000ms: Acceptable
- > 3,000ms: Slow — consider optimizing
- Model choice: Larger models (GPT-4.1, Gemini 2.5-Pro) are slower but more capable. Smaller models (GPT-4.1-Mini, Gemini 2.5-Flash) are faster.
- Prompt length: Longer system prompts and conversation history increase processing time.
- Response length: Longer generated responses take more time.
- Provider load: LLM provider APIs can be slower during peak hours.
TTS Generation Time
What it measures: Time to convert the LLM’s text response into speech (Text-to-Speech). This is the final processing step before the caller hears the response. Hamsa’s TTS engine handles this automatically. As a reference, here are typical ranges:- < 400ms: Fast
- 400ms - 600ms: Normal
- 600ms - 800ms: Acceptable
- > 800ms: Investigate
If TTS times are consistently high, contact support. TTS performance is managed by Hamsa’s infrastructure.
Latency
What it measures: Total end-to-end response time from when the caller stops speaking to when they hear the agent’s reply.- < 2,000ms: Excellent
- 2,000ms - 3,000ms: Normal
- 3,000ms - 4,000ms: Acceptable
- > 4,000ms: Poor — likely impacting conversation quality
Error Rate
What it measures: Percentage of sessions that encountered errors. As a reference, here are typical ranges:- < 1%: Excellent
- 1% - 3%: Normal
- 3% - 5%: Acceptable
- > 5%: Problematic — investigate
A small error rate (1-2%) is normal in production. If you see a sustained rate above 5% or a sudden spike, contact support.
Performance Bar Chart
The chart displays ASR, LLM, TTS, and Latency metrics side-by-side. Since Latency is the total of all components, focus on comparing the ASR, LLM, and TTS bars to identify which component is contributing the most to overall response time.- X-axis: Metric names
- Y-axis: Time in milliseconds
- Hover over bars to see exact values
Optimizing Performance
The primary lever you have for improving performance is LLM configuration. ASR and TTS are handled by Hamsa’s infrastructure.Choose the Right Model
Balance speed and quality based on your use case:| Use Case | Recommended Models | Why |
|---|---|---|
| Simple Q&A / FAQ | GPT-4.1-Mini, Gemini 2.5-Flash | Fast responses, sufficient quality for straightforward queries |
| Customer support | GPT-4.1-Mini, Gemini 2.5-Flash | Good balance of speed and understanding |
| Complex advisory | GPT-4.1, Gemini 2.5-Pro | Better reasoning, accepts higher latency |
| Sales / high-touch | GPT-4.1-Mini, Gemini 2.5-Flash | Low latency critical for natural conversation |
Optimize Your Prompts
- Keep system prompts concise: Remove unnecessary examples or verbose instructions. Every token adds latency.
- Limit conversation history: If your agent carries long conversations, consider limiting context to the most recent messages.
- Encourage shorter responses: Guide the model to be concise through your prompt instructions. Shorter responses generate faster and are easier for callers to follow.
Bring Your Own Model
If you’re using a custom OpenAI-compatible endpoint, the LLM response time depends entirely on your provider’s performance. Monitor this metric to ensure your provider meets your latency requirements.Filtering and Comparison
By Agent
Compare performance across different agents to understand how model and prompt choices affect speed:- Select a specific agent from the filter
- Note the metrics
- Switch to another agent and compare
By Date Range
Use date range filters to spot trends or investigate issues:- Today vs Yesterday: Detect sudden degradation
- This Week vs Last Week: Identify trends
- Custom range: Investigate specific incidents
Troubleshooting
High LLM Response Time
This is the most common performance issue and one you can address:- Switch to a faster model — try GPT-4.1-Mini or Gemini 2.5-Flash
- Shorten your system prompt — remove redundant instructions
- Reduce conversation history — less context means faster processing
- Check your LLM provider status — if using a custom endpoint, verify it’s performing normally
High ASR or TTS Times
These are managed by Hamsa. If you notice consistently high values:- Contact Hamsa support with the affected agent and time range
Error Rate Spike
- Check if the issue is specific to one agent or all agents
- If using a custom LLM endpoint, verify your provider is operational
- Contact Hamsa support if the issue persists
API Reference
Get Performance Analytics
Retrieve performance metrics programmatically.
Related
Dashboard Overview
View overall system metrics and statistics
Live Calls
Monitor active calls in real-time
Call History
Review individual call details and metrics
Satisfaction
Understand how performance impacts customer satisfaction