> ## Documentation Index
> Fetch the complete documentation index at: https://docs.tryhamsa.com/llms.txt
> Use this file to discover all available pages before exploring further.
# Overview
> Monitor your voice AI system's overall activity with session counts, durations, and call distribution analytics
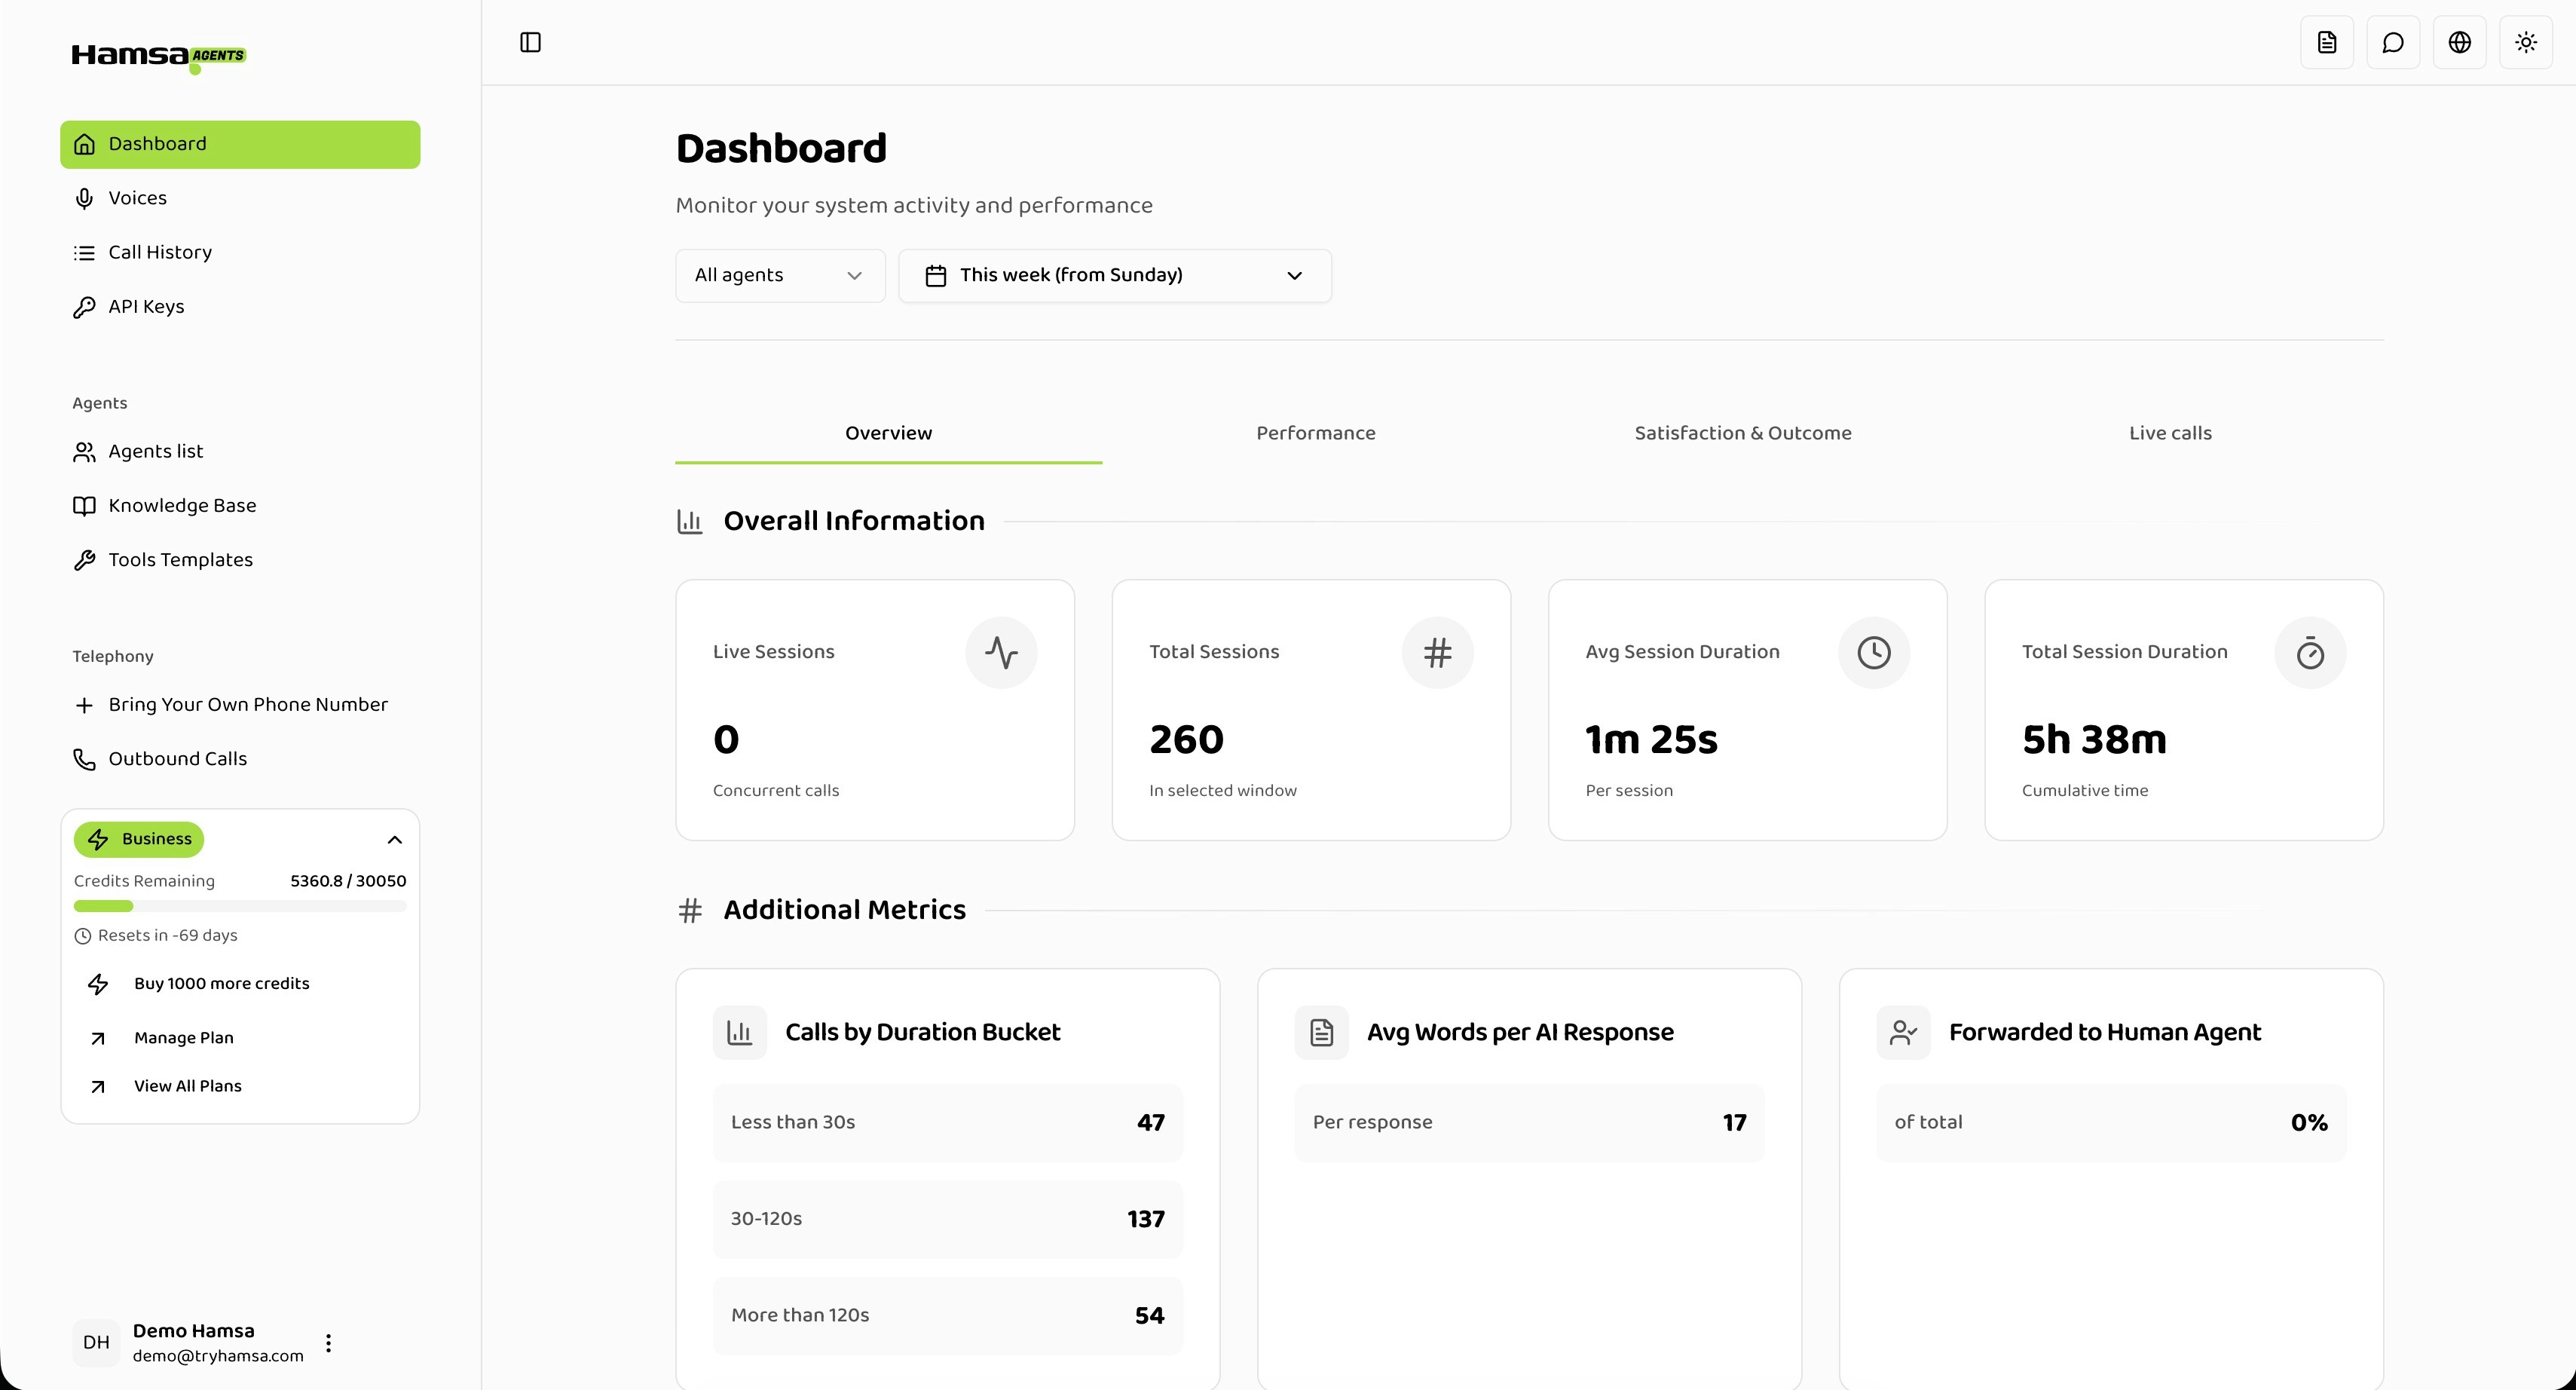
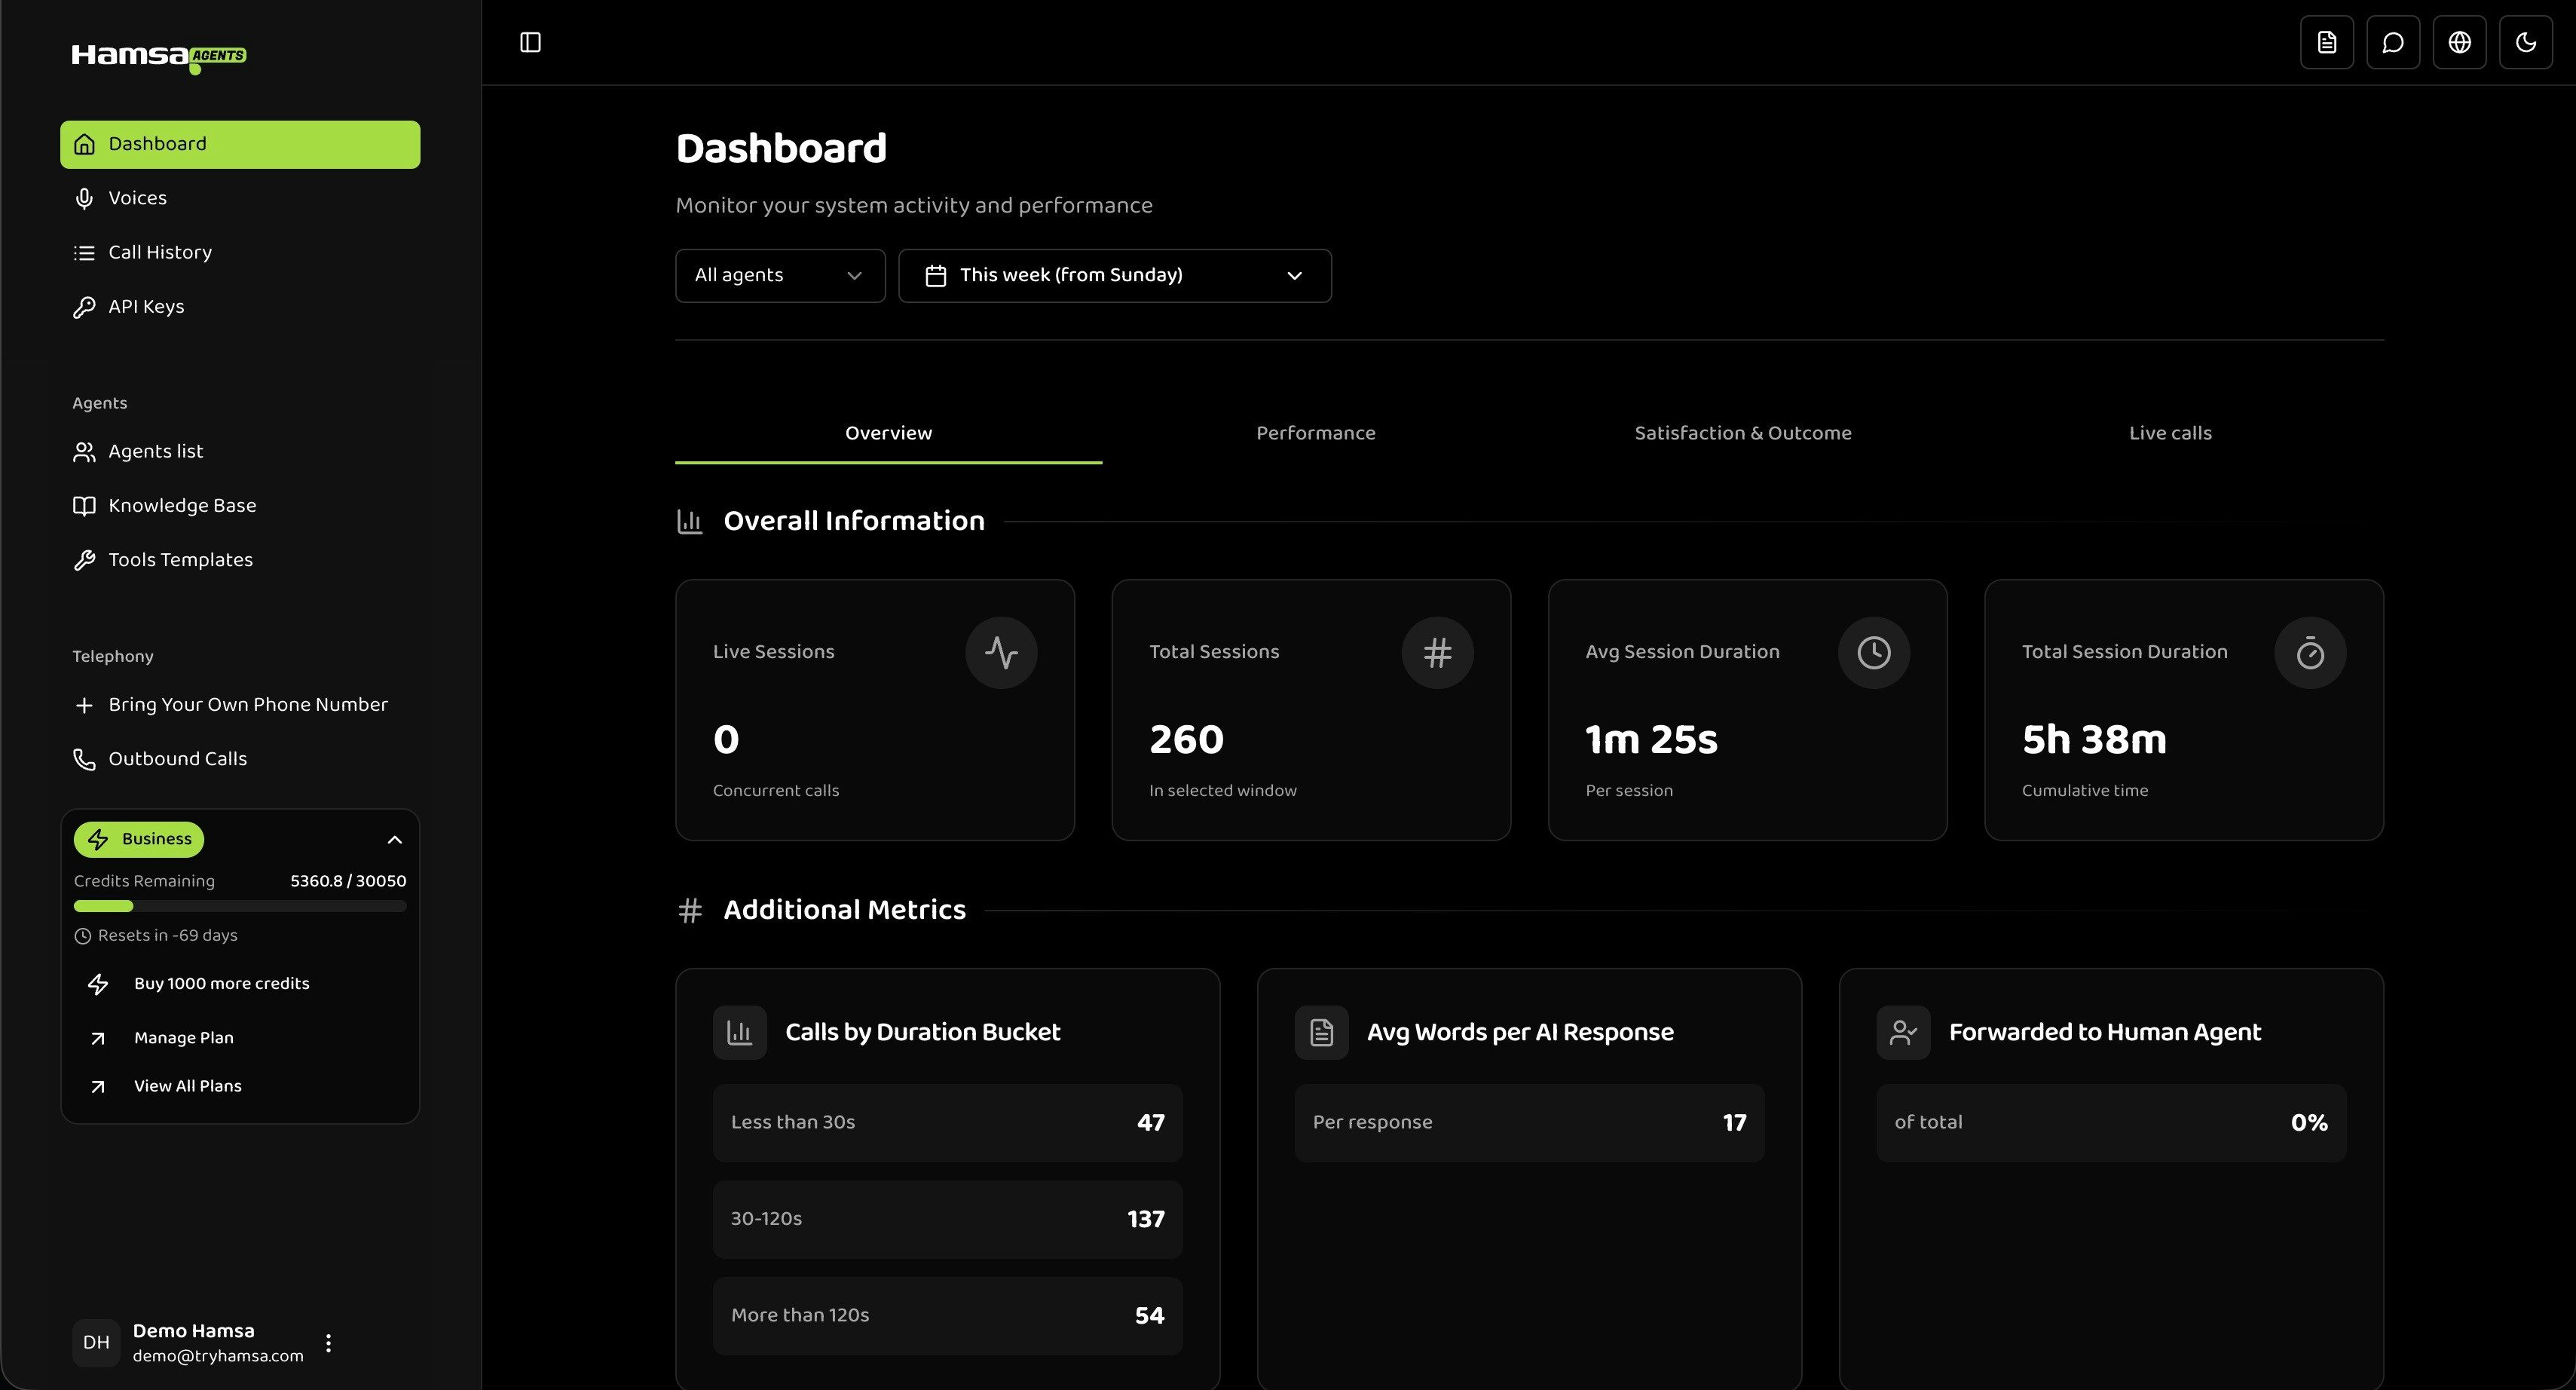
The Overview tab is your primary view for monitoring overall system activity. It displays real-time metrics and historical data based on your selected filters.
 ### Accessing the Overview
1. Navigate to **Dashboard** from the main navigation menu
2. The **Overview** tab opens by default
3. Use the filter controls at the top to refine your view:
* **Agent Filter**: Select "All agents" or a specific voice agent
* **Date Range**: Choose from preset ranges or custom dates
## Overall Information Metrics
The top section displays four primary metrics:
### Live Sessions
The number of concurrent active calls happening right now.
### Total Sessions
The total number of completed sessions within your selected date range.
### Average Session Duration
The mean duration of all sessions in your selected time range, displayed in minutes and seconds (e.g., "2m 34s").
Very short average durations (under 30 seconds) may indicate call quality issues or premature disconnections. Check your call history to identify the cause.
### Total Session Duration
The cumulative time of all sessions combined, displayed in hours and minutes (e.g., "52h 18m").
## Additional Metrics
### Calls by Duration Bucket
Categorizes calls into three duration ranges:
* **Less than 30s**: Very short calls (quick queries or disconnections)
* **30-120s**: Medium-length calls (standard conversations)
* **More than 120s**: Long calls (complex issues or extended interactions)
Most calls should fall in the 30-120s range for typical use cases. A high number of calls under 30s may indicate connection issues or callers hanging up quickly.
### Average Words per AI Response
The average number of words the AI agent uses in each response.
As a reference:
* **\< 20 words**: Responses may be too brief to be helpful
* **20-60 words**: Typical for natural conversation
* **> 80 words**: May overwhelm callers — consider adjusting your prompt to encourage conciseness
### Forwarded to Human Agent
The percentage of calls that were escalated to a human agent.
As a reference:
* **\< 10%**: High AI containment
* **10% - 20%**: Acceptable for most use cases
* **> 20%**: Agent may need expanded knowledge base or capabilities
## Charts
### Accessing the Overview
1. Navigate to **Dashboard** from the main navigation menu
2. The **Overview** tab opens by default
3. Use the filter controls at the top to refine your view:
* **Agent Filter**: Select "All agents" or a specific voice agent
* **Date Range**: Choose from preset ranges or custom dates
## Overall Information Metrics
The top section displays four primary metrics:
### Live Sessions
The number of concurrent active calls happening right now.
### Total Sessions
The total number of completed sessions within your selected date range.
### Average Session Duration
The mean duration of all sessions in your selected time range, displayed in minutes and seconds (e.g., "2m 34s").
Very short average durations (under 30 seconds) may indicate call quality issues or premature disconnections. Check your call history to identify the cause.
### Total Session Duration
The cumulative time of all sessions combined, displayed in hours and minutes (e.g., "52h 18m").
## Additional Metrics
### Calls by Duration Bucket
Categorizes calls into three duration ranges:
* **Less than 30s**: Very short calls (quick queries or disconnections)
* **30-120s**: Medium-length calls (standard conversations)
* **More than 120s**: Long calls (complex issues or extended interactions)
Most calls should fall in the 30-120s range for typical use cases. A high number of calls under 30s may indicate connection issues or callers hanging up quickly.
### Average Words per AI Response
The average number of words the AI agent uses in each response.
As a reference:
* **\< 20 words**: Responses may be too brief to be helpful
* **20-60 words**: Typical for natural conversation
* **> 80 words**: May overwhelm callers — consider adjusting your prompt to encourage conciseness
### Forwarded to Human Agent
The percentage of calls that were escalated to a human agent.
As a reference:
* **\< 10%**: High AI containment
* **10% - 20%**: Acceptable for most use cases
* **> 20%**: Agent may need expanded knowledge base or capabilities
## Charts
 ### Calls by Duration Bucket (Pie Chart)
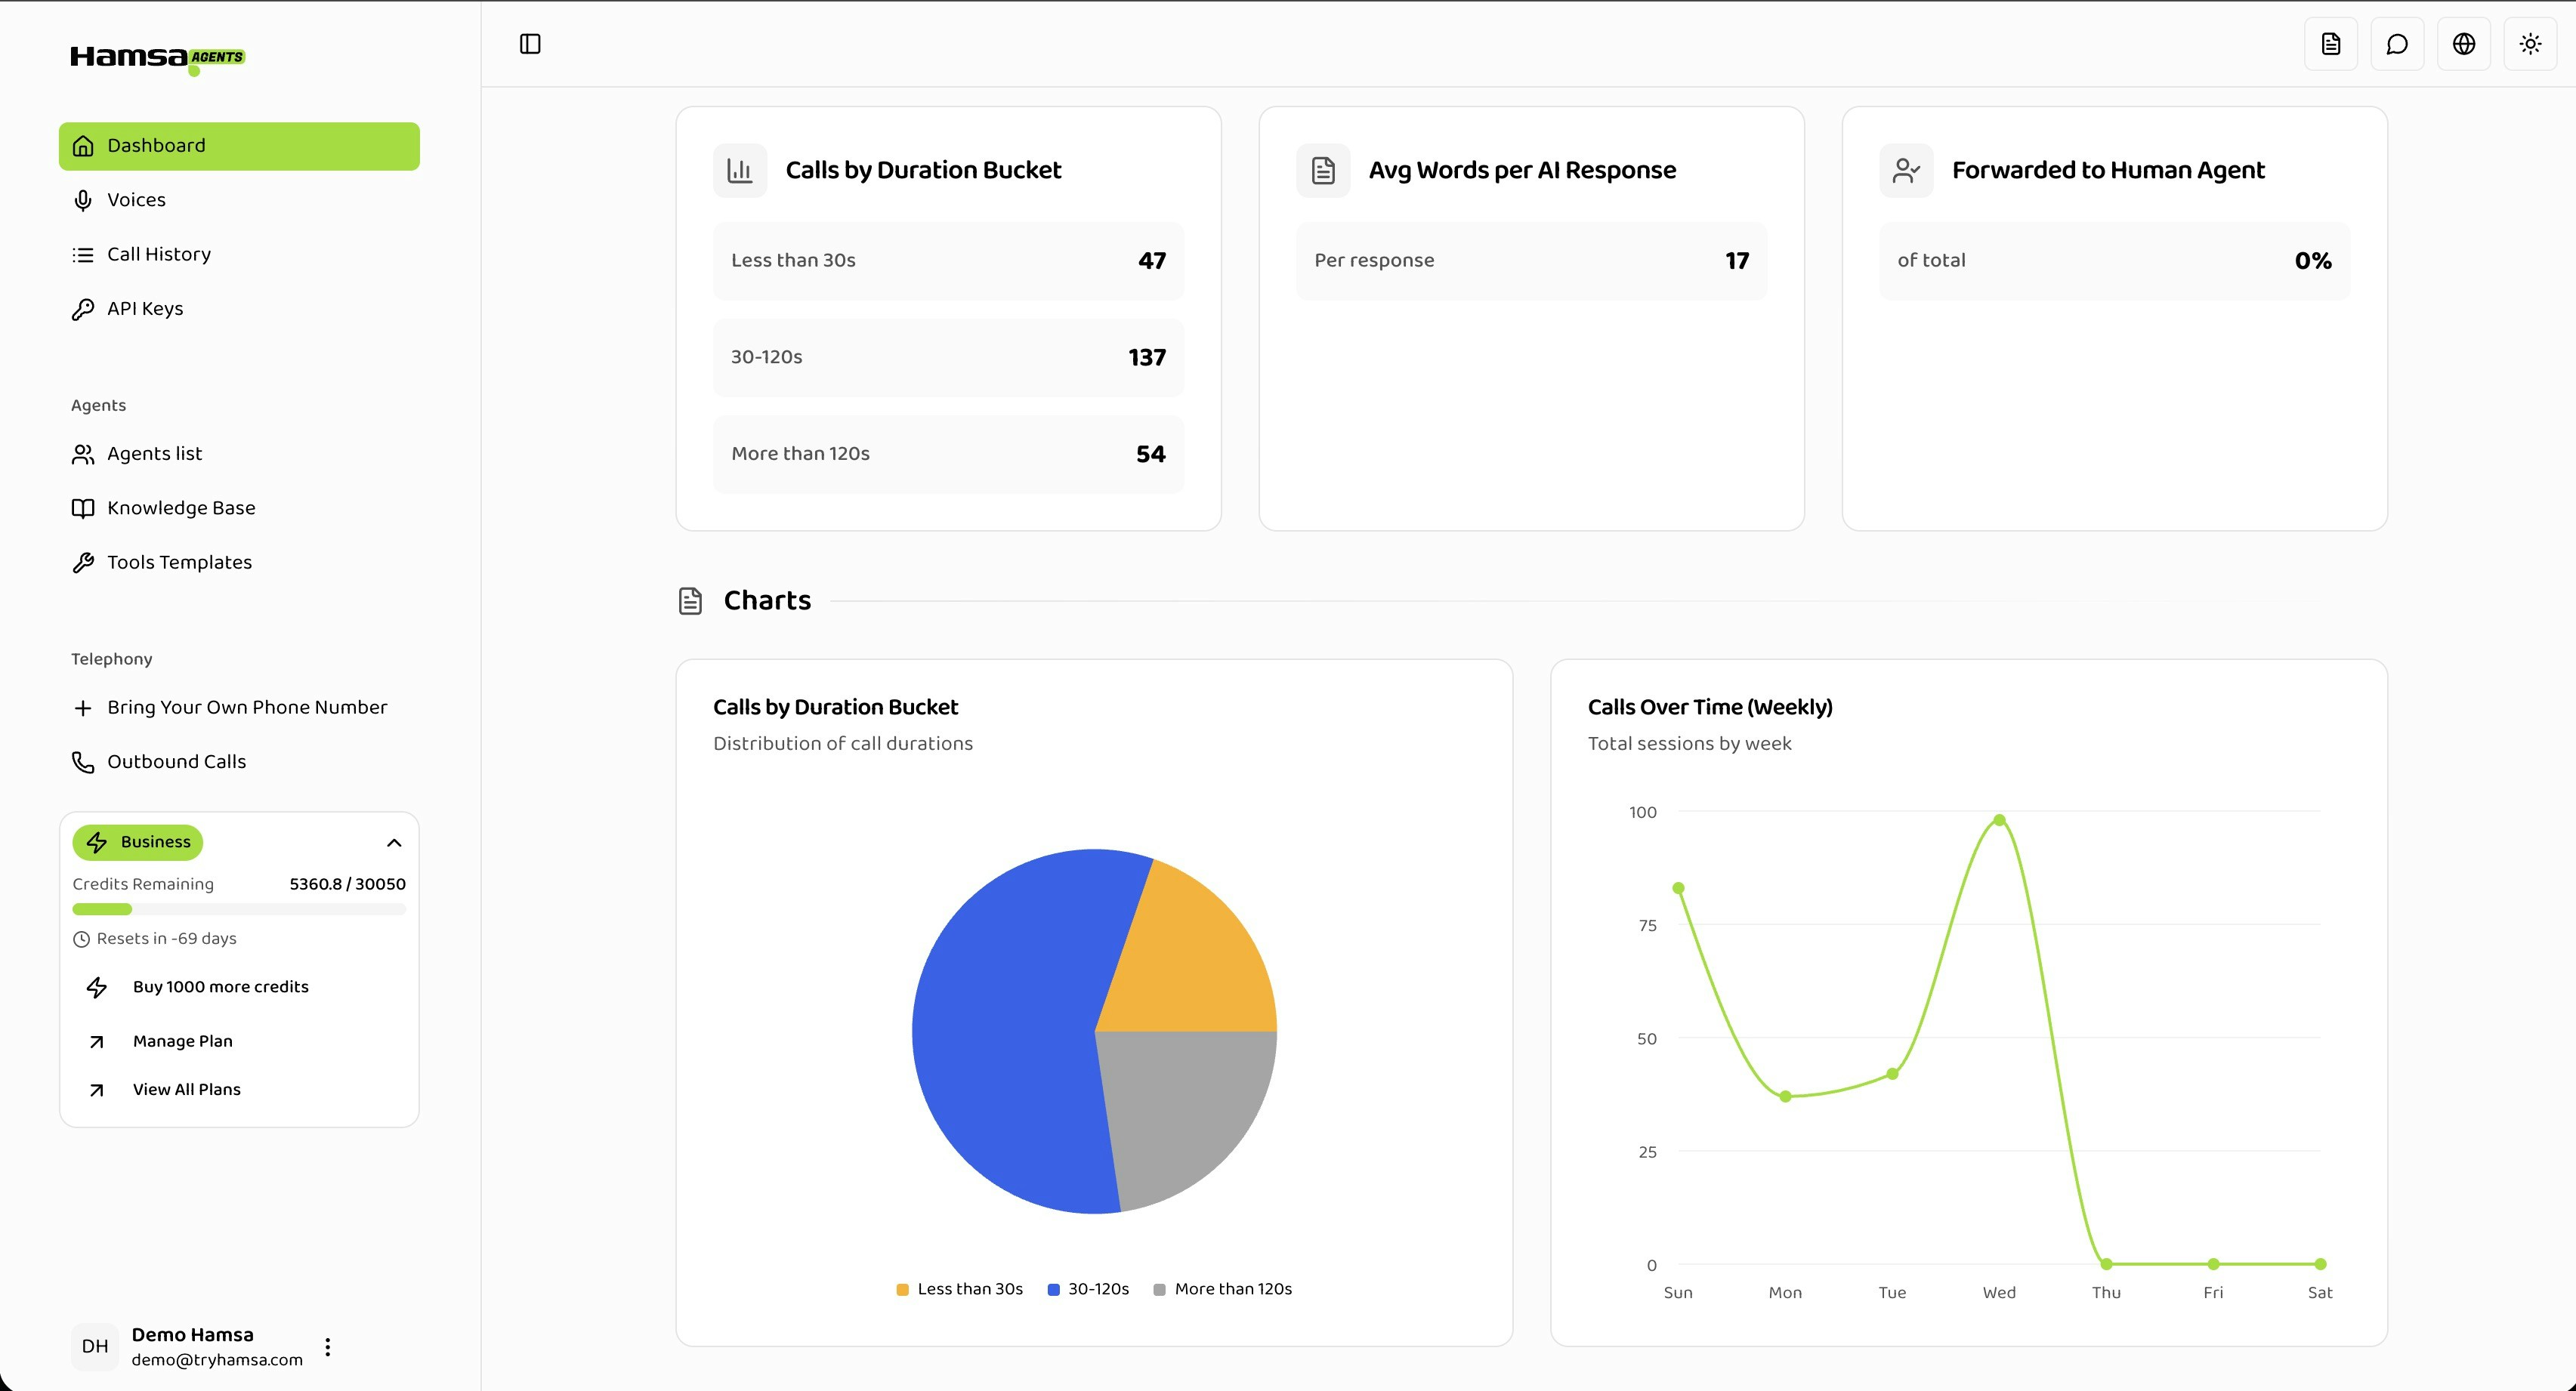
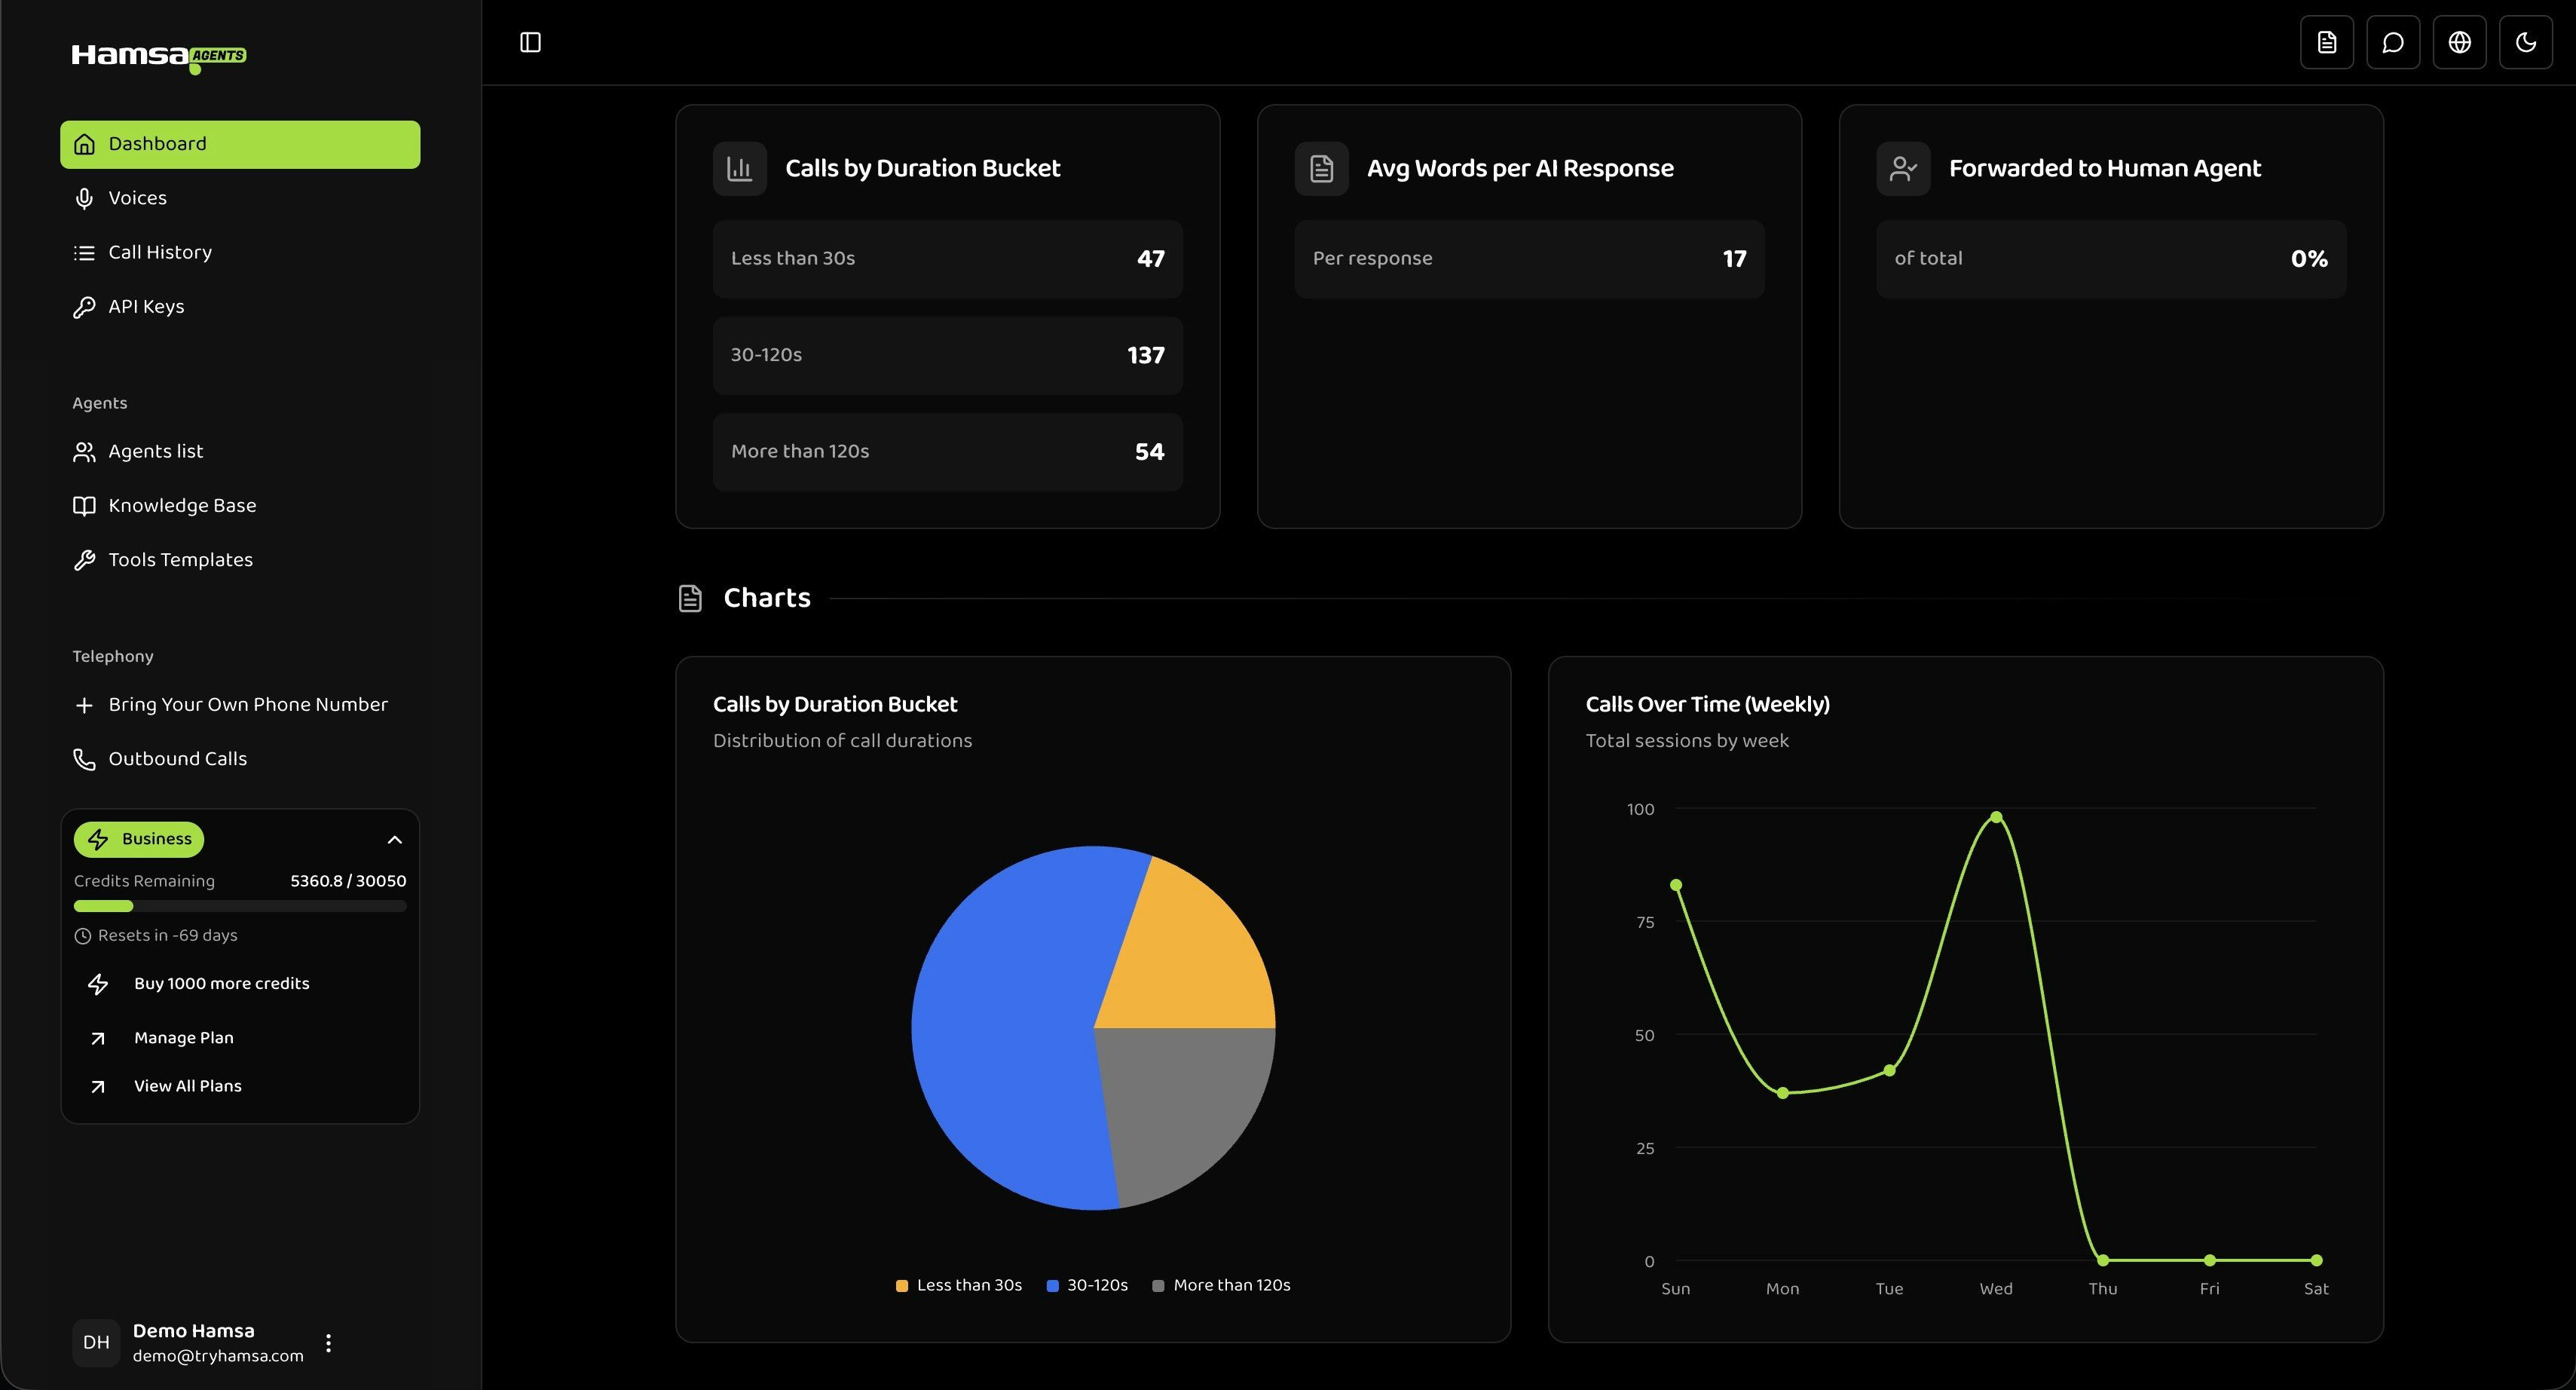
Visual distribution of calls across the three duration buckets. Hover over segments to see exact counts and percentages.
### Calls Over Time (Line Chart)
Call volume over time, with granularity based on your selected date range:
* **Today or Yesterday**: Hourly breakdown
* **This Week / This Month**: Daily breakdown
* **Custom range**: Automatically adjusts (hourly, daily, weekly, or monthly)
Use this chart to identify peak usage hours, spot volume trends, or measure the impact of changes you've made.
## Filtering
### Agent Filter
Filter all metrics and charts by a specific agent. Switch between agents to compare their metrics individually.
The agent filter is single-select. When "All agents" is selected, you see aggregated data across your entire system.
### Date Range Filter
Choose from preset ranges or create custom date ranges:
* **Today**: Current day (midnight to now)
* **Yesterday**: Previous full day
* **This Week**: Sunday to today
* **This Month**: First day of month to today
* **Custom**: Select any start and end date
All times are displayed in your browser's local timezone.
## Troubleshooting
### No Data Available
* Verify you have calls in the selected date range
* Try selecting "All agents" if a specific agent is filtered
* Expand your date range (e.g., from "Today" to "This Week")
### Metrics Show Zero
* Your selected date range may have no activity
* The filtered agent may have no calls in that period
* Wait a few seconds for data to finish loading
### Slow Loading
* Reduce the date range — large ranges process more data
* Filter by a specific agent instead of "All agents"
* Use preset date ranges rather than custom ranges spanning many months
## API Reference
Retrieve session counts, durations, and call volume trends.
## Related
Monitor active calls in real-time and join as a listener
Analyze system performance and response times
Track customer satisfaction and sentiment analysis
Search and review detailed call logs and transcripts
### Calls by Duration Bucket (Pie Chart)
Visual distribution of calls across the three duration buckets. Hover over segments to see exact counts and percentages.
### Calls Over Time (Line Chart)
Call volume over time, with granularity based on your selected date range:
* **Today or Yesterday**: Hourly breakdown
* **This Week / This Month**: Daily breakdown
* **Custom range**: Automatically adjusts (hourly, daily, weekly, or monthly)
Use this chart to identify peak usage hours, spot volume trends, or measure the impact of changes you've made.
## Filtering
### Agent Filter
Filter all metrics and charts by a specific agent. Switch between agents to compare their metrics individually.
The agent filter is single-select. When "All agents" is selected, you see aggregated data across your entire system.
### Date Range Filter
Choose from preset ranges or create custom date ranges:
* **Today**: Current day (midnight to now)
* **Yesterday**: Previous full day
* **This Week**: Sunday to today
* **This Month**: First day of month to today
* **Custom**: Select any start and end date
All times are displayed in your browser's local timezone.
## Troubleshooting
### No Data Available
* Verify you have calls in the selected date range
* Try selecting "All agents" if a specific agent is filtered
* Expand your date range (e.g., from "Today" to "This Week")
### Metrics Show Zero
* Your selected date range may have no activity
* The filtered agent may have no calls in that period
* Wait a few seconds for data to finish loading
### Slow Loading
* Reduce the date range — large ranges process more data
* Filter by a specific agent instead of "All agents"
* Use preset date ranges rather than custom ranges spanning many months
## API Reference
Retrieve session counts, durations, and call volume trends.
## Related
Monitor active calls in real-time and join as a listener
Analyze system performance and response times
Track customer satisfaction and sentiment analysis
Search and review detailed call logs and transcripts